Download
1 / 14
140 likes | 252 Views
ESD. 71 Application Portfolio Evaluating flexibility – Grid Scale Solar PV Plants. Tanvir Madan M.S. Technology and Policy Program, December 9 th , 2011. Overview > Description> Design> Implementation> Results> Lessons. Application Portfolio - Overview. System Description System Design

E N D
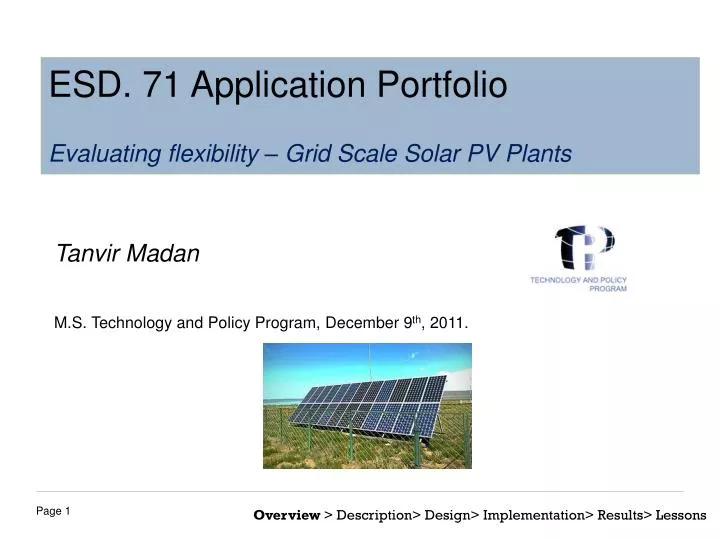
ESD. 71 Application Portfolio Evaluating flexibility – Grid Scale Solar PV Plants Tanvir Madan M.S. Technology and Policy Program, December 9th, 2011. Overview > Description> Design> Implementation> Results> Lessons
Application Portfolio - Overview • System Description • System Design • Method of implementation • Uncertainty • Flexibility • Simulation • Results • Fixed Design • Flexible Design • Target curves and other criteria • Lessons Learned Abstract: This project aims to evaluate the introduction of flexibility into designing grid-scale solar power plants. There exist certain forms of tracking PV panels that can be manually tracked/ moved in order to increase the output of the plant. At the same time though, certain costs are incurred to introduce flexibility by employing manual labor and hence through this project, taking into account certain core uncertainties in this system, we hope to address whether employing manual labor will help the overall financials of the PV project. Overview > Description> Design> Implementation> Results> Lessons
Application Portfolio - Description • Grid connected 5MW PV project, operational for 25 years • Based on financial model built while interning this summer at an Independent Power Producer • Technical and Financial inputs; Financial outputs • Economic Evaluation metric of choice – Equity Internal Rate of Return (IRR); ease of comparison to large cost of capital (interest rate) Overview > Description> Design> Implementation> Results> Lessons
Application Portfolio – System Design • Three underlying variables evaluated • Plant load factor (PLF) • Engineering, Procurement and Construction costs (EPC) • Interest rates • PLF evaluated to be most sensitive – hence PLF to be modeled as an uncertain distribution Overview > Description> Design> Implementation> Results> Lessons
Application Portfolio - Implementation • Step 1: Adding uncertainty (in PLF) to pre-existing model • Step 2: Adding flexible design choice to model • Step 3: Evaluating flexible model using economic evolution metrics Overview > Description> Design> Implementation> Results> Lessons
Application Portfolio – Implementation Step 1 • Using existing data to model distribution of uncertainty • Modeled as normal distribution with mean as predicted and variance of 1% • Utilizing other existing input and output parameters from a benchmarked case Overview > Description> Design> Implementation> Results> Lessons
Application Portfolio – Implementation Step 2 • Flexibility in question: employing labor to manually track panels and increase output • Divided into 5 steps of 5 years each • Cost of flexibility: 3.5% of total project cost • Gain from flexibility: additional output i.e. potentially increased PLF There exist certain PV panels that are manually tracked i.e. they can be moved by manual labor in order to increase the output they can capture. Hence, project developers have the ability to make a decision on whether they will employ manual labor with an expectation of extracting a greater amount of energy from such panels. It is not atypical for panels to be manually moved as seasons change in order to allow the panels to face as large as possible amount of incident rays from the sun. Overview > Description> Design> Implementation> Results> Lessons
Application Portfolio – Implementation Step 3 • Implemented choices • Decision tree (discrete distributions) • Lattice Model (stationary uncertainty) • Simulation • Decision – ifthe expected value of using flexibility > expected vale of base case, then exercise flexible choice Overview > Description> Design> Implementation> Results> Lessons
Application Portfolio – Results Fixed Design • Fixed Design • IRR of 13% • Flexible Design • Expected value always less than 13%! • Hand picked cases to evaluate target curves and other criteria (four cases) Overview > Description> Design> Implementation> Results> Lessons
Application Portfolio - Results Flexible Design Flexibility exercised in all periods Flexibility exercised in years 1-5 (time block 1 only) Overview > Description> Design> Implementation> Results> Lessons
Application Portfolio – Results Target Curve • Fixed design – highest expected IRR • Flexible design – betterabout 25% of the time • Risk nature of developer • Ability to extract and utilize information • Cases – all flexible cases similar – low sensitivity to timing of flexibility Overview > Description> Design> Implementation> Results> Lessons
Application Portfolio – Results Other Evaluation Criteria • The fixed design always provides a greater expected value. • Based on the target curves, there is a 60% probability for the flexible cases to return an IRR less than the mean of the base case (13%) • As expected, the standard deviation is higher for the flexible projects. • The P5 and P95 numbers demonstrate the variation b/w the fixed and flexible designs. A risk taking developer looking to capture some of the low probability upside would find this information exciting! Overview > Description> Design> Implementation> Results> Lessons
Application Portfolio – Main Lessons Overview > Description> Design> Implementation> Results> Lessons
Application Portfolio – Questions? Source: http://www.coachwithjeremy.com/ Source: http://37signals.com/ Overview > Description> Design> Implementation> Results> Lessons