Download
1 / 22
230 likes | 412 Views
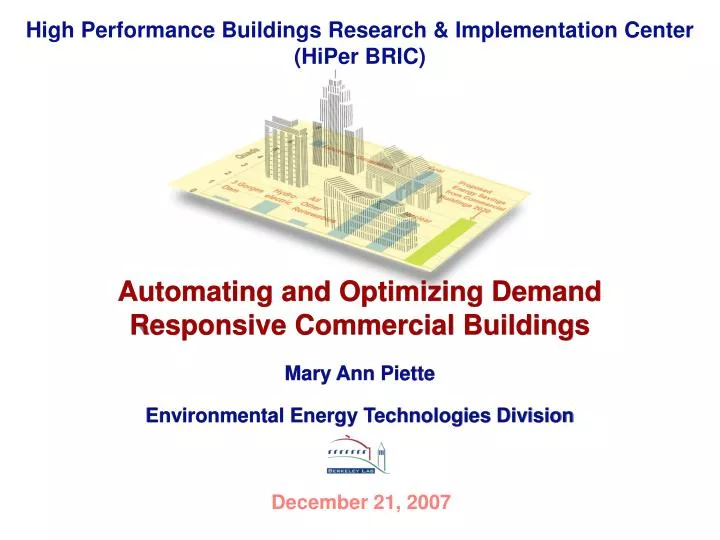
High Performance Buildings Research & Implementation Center (HiPer BRIC). Automating and Optimizing Demand Responsive Commercial Buildings. Mary Ann Piette Environmental Energy Technologies Division. December 21, 2007. Coupled Interactions. Sunlight. Local Thermal/ Humidity Control.

E N D
High Performance Buildings Research & Implementation Center (HiPer BRIC) Automating and Optimizing Demand Responsive Commercial Buildings Mary Ann Piette Environmental Energy Technologies Division December 21, 2007
Coupled Interactions Sunlight Local Thermal/ Humidity Control Local Thermal/ Humidity Control External Ventilation Outside Air Temperature/ Humidity Info Appliance Power Control Lighting/ Window/ Facade Control • Sensor Modules • Occupancy • Temperature • Humidity • Air Quality • Light • Appliances • Sensor Modules • Occupancy • Temperature • Humidity • Air Quality • Light • Appliances Thermal Storage Capacity/ Temperature Info Waste Heat Lighting/ Window/ Facade Control Appliance Power Control Central Air Conditioning/ Heat Pump Coupled Interactions Electricity Storage Building Operating Platform (BOP) Real-time optimization - consumption, cost, carbon footprint Building Simulation, Modeling & Analysis (DOE-2; EnergyPlus) Onsite Power Generation • Output • Energy Consumption • Indoor air quality and security data • Integrated and component system performance • Goal • Zero energy and/or carbon building • Healthy, comfortable, safe/secure environment • Minimum cost Electricity Tariffs & Carbon Emission Rates Current &Future Weather External Power Technical Scope of Buildings Network Communication Layer
Demand Response Definitions and Technology Needs DR Definition: Action to reduce load when • Contingencies occur that threaten supply-demand balance • Market conditions occur that raise supply costs • peak-load reductions different from efficiency, transient vs. permanent DR Communications Infrastructure Needs • Create real-time, automated DR infrastructure to respond to changing contingency and market conditions • DR infrastructure should coexist with legacy systems, technology and tariff improvements, with near- and long-term benefits.
Automated DR Project Past and Present Recent Research Goals • Cost - Develop low-cost, automation infrastructure to improve DR capability in California • Technology - Evaluate “readiness” of buildings to receive signals • Capability - Evaluate capability of control strategies for current and future buildings AutoDR Definition - Fully automated signal for end-use control • Signaling – Continuous, secure, reliable, 2-way communication with listen and acknowledge signals • Industry Standards - Open, interoperable standard control and communications to integrate with both common EMCS and other end-use devices that can receive a relay or similar signals (such XML) • Timing of Notification - Day ahead and day of signals are provided to facilitate a diverse set of end-use strategies
DR Automation Server w/ DRAS Client DRAS Clients – 1. Software only (Smart) 2. Software & Hardware (Simple)
Auto-DR in 130,000 ft2 County Office with Optimized Shed Shape
Improving DR capability in Buildings – from Present to Future • Improved levels of granularity/modular control • Improved intelligence of building modes – lighting, HVAC, other • Improved end-use metering, service level performance metrics • Multi-objective optimization
Time Scales of Building/Grid Optimization – Automated DR Future Time of Use Optimized
Multi-objective Optimization Energy • On/off mode/control • Weather/solar/wind • Occupancy/comfort/schedule • Equipment loads • Continuous diagnostics Operating Costs • Rate $/kWh, TOU, demand charges • Dynamic – critical, variable peak, RTP • DR program – shed frequency, duration • Maintenance and operations Emissions • Real-time CO2/kWh (time of day) • Grid or on-site power • Energy source Demand Response/Grid • Loads to limit, shift, shed • Service level control capability • Service level requirements Duration, frequency of DR participation • Spinning reserve participation
Research Needs and Operations Vision MODELING AND MONITORING • Improved real-time models and model predictive control • Improved sensing and forecasting of occupancy, lighting, HVAC, misc. loads • Continuous diagnostics • Dashboard objects and common performance metrics DISSEMINATION • Test bed demonstrations • Engineering guides and training EXTERNAL DATA NEEDS • Economic feedback – standard representation of tariff structures • Common communications infrastructure • Real-time and forecasted emissions data • Grid/on-site generation status LOW POWER (DR) MODES • Designed, commissioned and controlled as part of building lifecycle • Continuous “mode” optimization
Linking DR and Energy Efficiency Ideal start - good commissioning, retro-commissioning, advanced/new controls • HVAC - Direct digital control (DDC) global temperature adjustment • In process for Title 24 2008 • Closed loop • Lighting Continuum - Zone Switching, Fixture Switching, Lamp Switching, Stepped Dimming, Continuous Dimming • Maybe you “can” use a strategy every day?
2006 Auto-CPP Participants (n=24)Wide variety of building types
# of Sites/ Location Peak Shift (W/ft2) % (whole building) Strategies Comfort Peak outside temp oF 2003 1 / Santa Rosa 2.3 ~60% Pre cool – one step temp set up No complaints 90-95 2004 2 /Santa Rosa, Sacramento 0.5~2.0 10~66% Pre cool – one step temp set up Comfort survey 85-90 2005 2 / Oakland 0.5~1.0 10~25% Pre cool - various shed & recovery strategies Comfort survey, indoor monitors 80-85 2006 1 / Visalia 0.5~1.0 10~15% Pre cool - various shed & recovery strategies Comfort survey, indoor monitors 95-100 Related Research - Pre-Cooling Studies
Aggregated AutoDR Results – June 26, Zone 2 OAT and CPP Baselines show different results 1.3 MW reduction during high price period