Download
1 / 19
190 likes | 416 Views
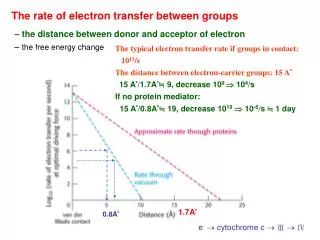
DETERMINATION OF THE RATE OF AN ELECTRON TRANSFER REACTION BY FLUORESCENCE SPECTROSCOPY. Presenter:Sandor Kadar, Ph.D. Objective. to study the relationships among the absorption, fluorescence excitation, and fluorescence emission spectra of Ru ( bipyridyl ) 3 2+ ,

E N D
DETERMINATION OF THE RATE OF AN ELECTRON TRANSFER REACTION BY FLUORESCENCE SPECTROSCOPY Presenter:Sandor Kadar, Ph.D.
Objective • to study the relationships among the absorption, fluorescence excitation, and fluorescence emission spectra of Ru(bipyridyl)32+, • to determine the rate of the electron transfer reaction between Ru(bipyridyl)32+ and Fe3+ or Cu2+ . • to learn the basics of Fluorescence spectroscopy
Background/Theory • Promotion to a excited electronic state via absorption of a photon • Ground electronic state mostly populated on the lower vibrational levels • Excitation can occur to multiple vibrational state of the excited electronic state • ~10-15 s • Very small internuclear effect (Frank-Condon principle) vertical transition • Relaxation through radiationless process • Energy transfer as heat • Interaction with surrounding (e.g. solvent molecules) • ~10-12 -10-15 s • Relaxation to the ground electronic state • Photon emission (fluorescence) • Quenching (interaction with other molecules) Absorption/emission process
Fluorescence Rotational/Vibrational transitions
Fluorimeter • Monochromatic exiting beam • Perpendicular detector to exiting beam
Background/Theory Absorption/emission spectra • Emission maximum shifted to longer wavelength (lower energy) due to loss of energy via radiationless process(es) (Stokes shift) • “Semi-Mirror” nature of absorption and emission spectra http://web.nmsu.edu/~snsm/classes/chem435/Lab6/
Background/Theory Photochemical process http://web.nmsu.edu/~snsm/classes/chem435/Lab6/
Background/Theory 2.5. About the Ru-complexes • Extensively used as a photosensitizer in solar energy conversion systems • Used for dye-sensitized photovoltaic devices • Photochemical reactions • Photosensitive Belousov-Zhabotinski reaction: Ru(Bpy)32++ Bromomalonic acid • Chemical system used to model complex biological system (cardiac arrest CHEM335)
Experimental procedure* • Step #1: • Prepare 0.500 L of a stock solution of 1.00 x 10⁻⁵ M Ru(bipyridyl)32+ in 0.5 M H2SO4. • Step #2: • Prepare 0.100 L stock solutions of 2 x 10⁻³ M Fe3+ (from FeCl3•6H2O) and 2 x 10⁻¹ M Cu2+ (from CuSO4 or CuSO4•5H2O), using the Ru2+/H2SO4 solution prepared above as solvent. • Record the exact mass of the metal salts that are weighed so that you can determine the concentrations of the solutions to 3 significant figures. *Note: Steps are numbered according to the handout
Step #3: • Use the solutions from the previous step to prepare the following sets of solutions, diluting all with the Ru2+/H2SO4 solution, in 15-mL tubes using autopipets. • Use the calculated volume of the stock solutions and add the calculated volume • of Ru(Bpy)32+ solvent • Calculate all concentrations to 3 significant figures based on the concentrations of your stock solutions to use in subsequent calculations: [Fe3+][Ru(bipyridyl)32+ ] 2.00 x 10⁻⁴ M ~10-5 M 4.00 x 10⁻⁴ M ~10-5 M 8.00 x 10⁻⁴ M ~10-5 M 1 .20x 10-3 M ~10-5 M 1.60 x 10⁻³ M ~10-5 M 1.80 x 10⁻³ M ~10-5 M [Cu2+ ] 2.00 x 10⁻² M ~10-5 M 4.00 x 10⁻² M ~10-5 M 6.00 x 10⁻² M ~10-5 M 8.00 x 10⁻² M ~10-5 M 1.20 x 10⁻¹ M ~10-5 M 1.60 x 10⁻¹ M ~10-5 M 1.80 x 10⁻¹ M ~10-5 M • Step #4&5: • Obtain the absorption spectrum with the OceanOptics spectrophotometer and determine the wavelength of maximum absorbance (Abs) • Record the temperature around the fluorimeter
Absorption spectrum Emission spectrum Excitation spectrum Abs Ex Em Ex: 400-520 nm Ex:470 nm Ex: Abs Ex:Ex Em: Em Em: 480-650 nm Em: 480-650 nm Em: 480-650 nm Quenching experiments
Step #8: • Set the excitation (Ex) and emission wavelength (Em) to the values that you determined before • Determine the fluorescence intensity of a fresh sample of the ~10-5 M Ru(bipyridyl)32+.(take three readings) before and after you ran the solutions with quencher (to check for reproducibility) • Determine the fluorescence intensity of all solutions prepared (take three readings for each solution) • Collect three spectra with 0.5 M H2SO4 solution as well
Calculations Obtaining emission intensities • Calculate the average emission intensities from the three readings (six for the Ru(bipyridyl)32+ solution) for each solution • Subtract the average of the three H2SO4 spectra from each emission spectrum Plot the I0/I vs. x • Obtain the slope (kq/ks) for both, the Cu2+ and Fe3+ dataset Calculate ksfrom the table provided J.E. Baggott, M.J. Pilling, J. Phys. Chem. 84., 3012-3019 (1980)
Some questions • Did you get the same emission spectrum with excitation Abs (obtained from the absorption spectrum) and Ex=470 nm? If not, what is the difference between them and what do you think the reason is for the difference (Hint: Consider how the excitation and relaxation occurs in terms of the energy levels) • How is the emission spectrum different, if at all, if a range of photons are used instead of just a single wavelength for excitation? Does the structure of the emission spectrum change? Do the peak intensities change? Why (Hint: In either configuration, what limits how many excitation can occur)? • Do the quenching rate constants for Cu2+ and Fe3+ significantly differ? If so, why? Compare your results to the values in the table provided. • Compare your results with literature values: • http://www3.nd.edu/~ndrlrcdc/Compilations/Quench/RX1_130.htm • http://www3.nd.edu/~ndrlrcdc/Compilations/Quench/RX1_112.htm
Safety • Ru2+, Fe3+, and Cu2+ solutions are considered heavy metal waste and have to be disposed of accordingly • Use gloves. • Sulfuric acid: remember to add acid to water slowly and not the other way around. If your skin is exposed to sulfuric acid, use running water to wash it off. • Remember where the safety equipment (eye wash station, shower, etc.) is • Observe the general safety rules that your professor set for the lab!