Download
1 / 18
180 likes | 297 Views
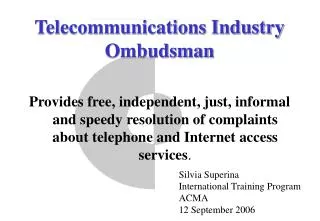
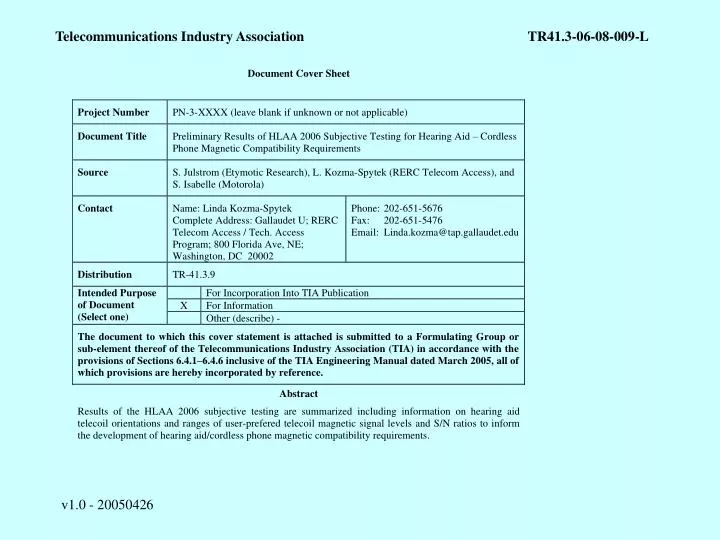
Telecommunications Industry Association TR41.3-06-08-009-L. Preliminary Results: Subject Testing for Hearing Aid – Cellphone/Cordless Phone Magnetic Compatibility Requirements S. Julstrom (Etymotic Research) L. Kozma-Spytek (RERC Telecom Access) S. Isabelle (Motorola).

E N D
Preliminary Results: Subject Testing for Hearing Aid – Cellphone/Cordless Phone Magnetic Compatibility Requirements S. Julstrom (Etymotic Research) L. Kozma-Spytek (RERC Telecom Access) S. Isabelle (Motorola) ORIGINAL TEST PLAN GOAL: “In support of the Jan. 17, 2006 PINS, to determine the ranges of user-preferred telecoil magnetic signal levels and S/N ratios, according to the measurement specifications and criteria laid out in ANSI C63.19. Some additional information will be gained on hearing aid telecoil orientations.” TESTING CONTINUATION: Following initial testing at Etymotic Research and the presentation of the initial results to the C63.19 working group, the number of test subjects was expanded from 12 to 57 with additional testing at Gallaudet University (n=19) and the 2006 HLAA convention (n=26). Two representative cordless phone interferences were added for the final HLAA round of testing.
The test subjects first filled out an extensive questionnaire. Then . . . First Step: Measure the telecoil orientation. Second Step: Choose the appropriate “magnetic hat”. Perpendicular (Axial) Transverse (Radial 1) Longitudinal (Radial 2)
HA Telecoil Orientation Results: • Of 69 hearing aids tested for orientation • 66 were BTE (behind-the-ear) • 3 were ITE (in-the-ear) • Of the 57 subjects tested • The transverse hat (radial 1) was used 53 times. • The longitudinal hat (radial 2) was used 1 time. • The perpendicular hat (axial) was used 3 times. • 65 of the 69 measured aids had orientations in the plane of the side of the head at some angle from the vertical; that is, in a radial, not axial orientation. The next slide shows a histogram of these radial angles, along with a graph showing that the vast majority of these are covered well by a transverse orientation field (parallel to the top of the handset). Only a couple of outliers respond primarily to a longitudinal field.
Magnetic signal source with perpendicular (axial), transverse (radial) and longitudinal (radial) components HA telecoil with a vertical orientation Relative sensitivity of HA telecoil (with a vertical orientation) to transverse radial component of magnetic field (with 25º handset angle from horizontal) is reduced ~1dB from maximum coupling
Third Step: After finding the level of magnetic speech signal that matches a 65 dB-SPL acoustic speech signal for their hearing aid, the subject finds their preferred “most comfortable” magnetic telephone coupling level (MCL). The graph below shows that the subjects preferred to magnetically match 65 dB-SPL speech. Note: The -12.5 dB outlier came from the test subject who required the second strongest magnetic signal to match 65 dB-SPL, a level that would definitely result in hearing aid magnetic input overload. Reducing the magnetic signal well below that level apparently resulted in a more “comfortable” level (presumably less distorted).
-18 dB A/m (ANSI C63.19) -25 dB A/m (ANSI 3.22) Fourth Step: In addition to choosing a magnetic level to match 65 dB-SPL acoustic speech and a preferred MCL, the subjects also choose minimum and maximum acceptable magnetic speech levels. All this data is summarized in the graph below, which shows how far the MCL is above (white bars) or below (black bars) the 65 dB matching level and the range of acceptable levels. Evidently, hearing aids in the field have widely varying telecoil sensitivities in relation to their microphone sensitivities.
Fifth Step:For each noise type, the subjects select their noise tolerances for the clearly defined “usable”, “normal use”, and “excellent performance” categories and the tester finds their objective noise-in-the-presence-of-speech threshold. Instructions for Magnetic S/N Tests Excellent Performance - You would find a phone with this level of noise to be highly usable. You would have no complaints about this amount of noise for extended phone calls. Acceptable for Normal Use – You would find this level of noise to be acceptable for normal, regular use of a phone. You would accept this amount of noise for an extended phone call without becoming tense or tired. Usable for a Brief Call - With this level of noise you could successfully complete a brief phone call. However, you would not accept this amount of noise for normal, regular phone use.
Speech Sources AMR MR12.2 codec AMR MR12.2 codec AMR MR12.2 codec EVRC codec AMBE++ codec AMR MR12.2 codec VSELP codec ADPCM codec (32kb/s) ADPCM codec (32kb/s) Noise Sources 100 Hz, 20% DC (Training) GSM (J-STD-007) UMTS (T1/T1P1/3GPP) CDMA (TIA/EIA/IS 2000) iDEN Display TDMA (TIA/EIA-136) FHSS DSSS n 57 57 57 57 57 31 30 26 26 Test Stimuli Note: Time intermittency effects of the interference were not considered. All noise types were presented as continuous interfering signals.
S/N Results To most directly address the standards’ S/N requirements, the results can be viewed as the ratio of MCL to the category noise rating levels. In interpreting these S/N numbers, it is important to remember that the signal (MCL) levels are average speech levels measured per ITU P.56. These levels are typically ~15 dB lower than the signal level as measured per FCC Part 68. The noise levels are the 1 kHz equivalent A-weighted telecoil response levels. There is considerable subject-to-subject variation in the S/N category boundary judgments. This variability is smoothed by displaying the results as a cumulative distribution. The following graph shows the results plotted this way for the “normal use” category. The other categories show similar results, but shifted up or down.
Some differences among the noise types are apparent. The cordless modulation noises, at least with the relatively small sample of subjects tested, seem to require S/N’s similar to the cellphone noise types with the higher S/N requirements. The fact that the various noise types do not all show the same measured S/N needs indicates that the present noise measurement (A-weighting) does not fully account for the subjective annoyance characteristics of a given noise type. For example, the noise measurement underestimates the annoyance of cordless types and UMTS, and overestimates that of TDMA and display noise. While A-weighting may be a good first step towards the proper subjective level modifier, it probably is not the final answer. If the ideal noise measurement parameters could be found that accurately modeled noise annoyance and audibility, all the noise types, including future ones, would plot the same.
This graph plots the average cumulative distributions for the six cellphone noise types and the two cordless noise types. (Display noise is lumped in with the cellphone noise types, although it is potentially relevant for cordless, too.) From the far right of the graph, it can be seen that some subjects “required” S/N’s greatly in excess of their objective noise threshold S/N’s. (For whatever reason, they felt they needed to turn the “noise” knob way down.) Allowing for that oddity, a S/N requirement of 30 dB (45 dB with signal measured per Part 68) does not appear out of line.
Summary: • The overwhelming majority of hearing aids tested had a generally vertical orientation, emphasizing the importance of testing the transverse orientation (radial 1; parallel to the top of the handset). A phone should produce this field with good quality when positioned normally. • The preponderance of subjects prefer their magnetic level at a 65 dB-SPL equivalent. The magnetic level to achieve that varies widely among hearing aids, but the C63.19 established -18 dB(A/m) minimum should cover all the reasonably adjusted ones, with some margin. • 30 dB S/N (45 dB with signal measured per Part 68) is a justifiable minimum requirement (with the noise level measured A-weighted). • A-weighting is a good start as a subjective noise level modifier, but there is still enough variation among the various noise types to justify looking for a better or more complete future calculator of annoyance/audibility. • Noise tolerance is related to noise audibility threshold, independent of noise type or the subject’s hearing dynamic range. (Discussed more in the additional material following.) • Note: This is a preliminary presentation of results and is not intended for wider distribution or publication at this time. A formal paper is planned.
Addendum: Relationship of noise tolerance to noise audibility thresholdAnalysis of the results showed that noise tolerance for the various category ratings for a given noise type is directly related to the subjects' noise audibility threshold for that noise type, but not to any other evident characteristic of the noise type or, surprisingly, to the subject’s hearing dynamic range to any significant degree (as represented by their MCL to threshold ratio). In relation to the objective noise threshold, there is no significant difference among the noise types, no matter how their levels are measured. This can be clearly seen by re-visiting the “normal use” cumulative distribution graph, but now plotting in terms of the ratio of the rated category noise level to the objective noise threshold.
That the ratios of the category ratings to the objective noise threshold shows little, if any correlation to the subject’s hearing dynamic range can be seen by plotting the individual subject’s ratios, ordered by their dynamic range (MCL to threshold ratio). (Subject responses placing some of their “requirements” well below their objective noise threshold are clearly evident in the graphs.) The slopes of the trend lines are near zero, showing a consistent relationship to the noise threshold, but little relationship to the MCL above threshold.
The two graphs at the right are histograms of the ratio of the subjects’ rating responses (MCL or noise) to their objective noise thresholds, for two representative noise types. They illustrate that the category noise ratings maintain a consistent average relationship to the noise threshold across noise types, even in the midst of significant subject variability. The similarity of the graphs is evident.
With all eight noise types added in, the resultant smoother, more “bell-like”, the curves are matched here with best-fit normal distribution curves. These latter curves discount the influence of the extreme negative outlier data points far below objective threshold. The lower graph shows the consistency among noise types of the means and standard deviations of the noise category boundary ratings relative to noise threshold. A reasonable judgment for the three noise categories could be that for "excellent performance", the noise should not be greater than noise threshold (i.e., inaudible); for "normal use", ~4 dB above threshold; and for "usable", ~10 dB above threshold.