Download
1 / 14
140 likes | 243 Views
Victoria Sinclair Suzanne Gray & Stephen Belcher. Boundary layer ventilation by baroclinic systems. Questions. Conveyor belts are often assumed to be the dominant process in pollution transport – is this correct?

E N D
Victoria Sinclair Suzanne Gray & Stephen Belcher Boundary layer ventilation by baroclinic systems
Questions • Conveyor belts are often assumed to be the dominant process in pollution transport – is this correct? • How do pollutants get from surface based sources to heights where conveyor belts originate? • How and where are pollutants transported out of the boundary layer into the free troposphere ?
Methodology • Idealised dry baroclinic lifecycles in the Reading IGCM • LC1 and LC2 • differ by the addition of barotropic cyclonic shear to background state • Realistic boundary layer scheme • T42 L39 – well resolved BL • Tracer initialised • uniform concentration at lowest model level • acted upon by resolved winds and turbulent motions • no sources or sinks
Turbulent mixing. Day 3 Tracer concentration (kg kg-1) Red line indicates boundary layer depth Depth integrated tracer mass (kg) and surface pressure Thick black line marks cross-section
32 m 394 m Ekman motions. Day 4 Tracer concentration and wind vectors. Note different colour scales • Divergence out of anticyclones - low concentrations • Convergence into cyclonic regions - higher concentrations
LC1 LC1 LC1 LC2 LC2 LC2 Ventilation regions. Day 7 Tracer flux (x 10 5 kg s-1) out of the boundary layer 0.5 cm s-1 vertical velocity contours on the boundary layer top Surface pressure contours. 4mb contour interval
Total mass and tracer fluxes LC1 no sources Total mass flux (solid line) and tracer flux (dashed line) out of the boundary layer
Transport by conveyor belts LC1 LC2 Two equal, distinct branches Cyclonic branch dominates
LC1 LC2 Boundary layer ventilation rate • LC1 ventilates 26% of tracer and LC2 28% • Similar considering the different frontal evolution
Conclusions • Transport occurs by three distinct processes • Turbulent mixing • Ekman divergence and convergence • Advection by warm conveyor belts • Boundary layer processes control the amount of pollutants in the ventilation regions • Only the warm conveyor belt footprint region of the boundary layer is ventilated
v.a.sinclair@reading.ac.uk www.met.reading.ac.uk/~swr05vas Questions?
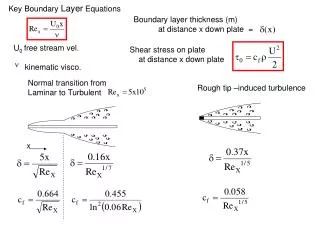
Boundary layer structure depth h/L • Across synoptic scales there are significant variations in the depth and stability of the boundary layer • The boundary layer structure is strongly coupled to the large scale dynamics.
Questions Conveyor belts are often assumed to be the dominant process in pollution transport – is this correct? How do pollutants get from surface based sources to heights where conveyor belts originate? How and where are pollutants transported out of the boundary layer into the free troposphere?
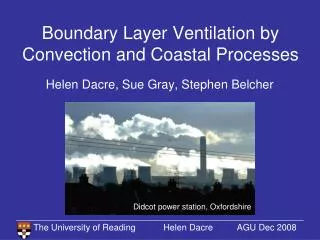
Transport Processes Boundary layer turbulence Local scale, hours Warm Conveyor Belt Regional scale, days