Download
1 / 1
10 likes | 180 Views
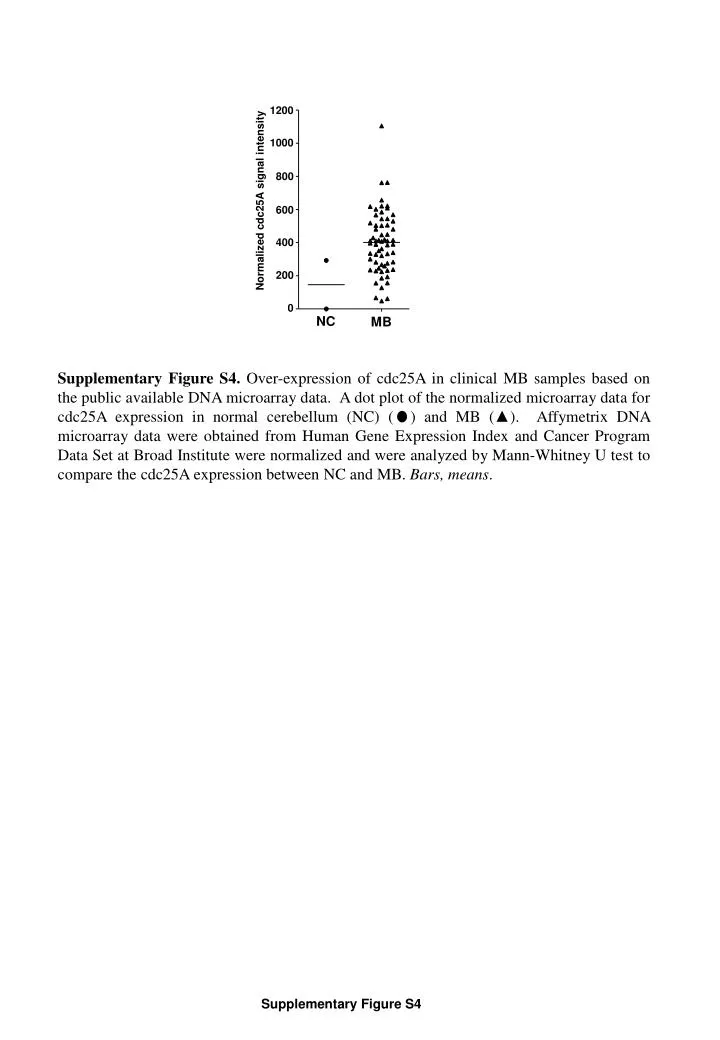
1200. 1000. 800. Normalized cdc25A signal intensity. 600. 400. 200. 0. NC. MB.

E N D
1200 1000 800 Normalized cdc25A signal intensity 600 400 200 0 NC MB Supplementary Figure S4. Over-expression of cdc25A in clinical MB samples based on the public available DNA microarray data. A dot plot of the normalized microarray data for cdc25A expression in normal cerebellum (NC) ( ) and MB (▲). Affymetrix DNA microarray data were obtained from Human Gene Expression Index and Cancer Program Data Set at Broad Institute were normalized and were analyzed by Mann-Whitney U test to compare the cdc25A expression between NC and MB. Bars, means. Supplementary Figure S4