Download
1 / 56

E N D
Project Title : Improve Air Handling Unit PerformanceTeam Leader: Edgardo NacpilAssistant Leader : Oscar Roman Members : Joselito Mendez (OAFA-FM) George Villamor (OAFA-FM) Eduardo de Veyra (OAFA-FM) William Seril (OAFA-FM) Arnel Allan Castro (OAFA-FM) Rommel Protacio (CPMI) Sonny Jose Marquez (CPMI)Champion : Chatiya Nantham
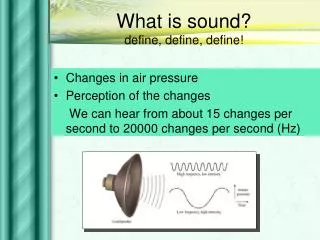
Project Charter DEFINE Business Case: One of the key functions of OAFA-FM is to maintain a reliable indoor air quality to all offices in this headquarters building complex. So operating and maintaining air-conditioning and mechanical ventilation (MVAC) system plays an important part. It consumes about 44% of the overall energy consumption of the headquarters and its cost of operation and maintenance is also relatively high. Therefore, this system has to be operated and maintained efficiently in order to meet the international standards (ASHRAE and EPA ) of air quality. This MVAC system consist of two sets of components, i) central refrigeration chillers in the plant room, cooling towers, chilled and condenser water pumps, a few kilometers of piping network, motorized and manual valves that provide cooling water( as a media) to remove the building heat from the offices/workplace and ii) air handling units, the office fan powered units and ventilation fans that supply fresh air and remove stale air from offices/workstations/meeting rooms and auditorium. In this six sigma project, the primary focus is to improve and sustain the operating efficiency of the aging air handling units, 47 units altogether in the tower block, which are more than 18 years old until they are replaced in the next 3 to 5 years.
Project Charter DEFINE Problem Statement: There are 47 air handling units in the tower block that are more than 18 years old and owing to aging condition of these units, the operating efficiency have degraded overtime and this has to be reevaluated to ensure their performance can be sustained for the next 3 to 5 years of operations until replaced. Project Goal: Improve the current operating performance of the old AHUs to at least 80% of their design capacity Project Scope: The project will focus on improving the performance of 14 sample air handling units located at the office block which are measured to be operating below 31 tons or 80% of their design capacity.
LEVEL 10 LEVEL 9 LEVEL 8 LEVEL B1 LEVEL 1 LEVEL 7 LEVEL 6 LEVEL 5 LEVEL 4 LEVEL 3 LEVEL 2 DEFINE TOWER BLOCK CORE 6 (EAST) CORE 2 (SOUTH) CORE 3 CORE 4 (WEST) CORE 5 (NORTH) CORE 1 Chilled Water Distribution Piping NOAS-6 NOAS-1 NOAS-2 NOAS-4 NOAS-3 NOAS-5 S-9F S-9A S-9B S-9D S-9C S-9E S-8F S-8A S-8B S-8D S-8C S-8E S-7F S-7B S-7D S-7C S-7E S-7A S-6F S-6A S-6B S-6D S-6C S-6E S-5F S-5A S-5B S-5D S-5C S-5E S-4F S-4A S-4B S-4D S-4C S-4E S-3F S-3A S-3B S-3D S-3C S-3E S-2F S-2A S-2B S-2D S-2C S-2E CENTRAL PLANT ROOM COOLING TOWER S-1F S-1A S-1B S-1D S-1C S-1E S-B3 S-B1 S-B2 BOOSTER PUMP BOOSTER PUMP BOOSTER PUMP BOOSTER PUMP BOOSTER PUMP BOOSTER PUMP Chilled Water Return CHILLER Chilled Water Supply CHWP COWP
Typical AHU Layout (Level 1 – Level 8) DEFINE Main Duct Loop AHU ROOM CORE-5 AHU ROOM CORE-6 AHU ROOM CORE-4 E D S A A D B A V E N U E AHU ROOM CORE-2 AHU ROOM CORE-3 AHU ROOM CORE-1 Main Duct Loop
High Level Process Map DEFINE Illustration of Air Handling Unit Operation FLOOR LEVEL F A N R O O M MAIN SUPPLY AIR DUCT LOOP CHILLED WATER SUPPLY CHILLED WATER RETURN SUPPLY AIR DUCT TO OFFICE SPACE SHUT OFF DAMPER FPU THERMOSTAT CEILING THERMO METER OUTSIDE AIR (TREATED & PRE-COOLED) SHUT OFF DAMPER PRESSURE GUAGE RETURN AIR PLENUM BLOWER CO2 SENSOR COOLING COIL AIR FILTER AIR HANDLING UNIT OFFICE 1 OFFICE 2 FLOOR LEVEL
High Level Process Map DEFINE Schematic Diagram of AHU Operation BMS TIME SCHEDULE ON OA DAMPER RA DAMPER SA DAMPER OPEN AHU FAN START PRESSURIZED THE MAIN DUCT TEMP. SETTING TIME SCHEDULE OFF MANUAL ON ON STATUS PITCHED BLADE OF FAN MODULATE CHILLED WATER MOTORIZED VALVE MODULATE When the supply fan is off, OA damper, discharge damper and the vane axial pitch blade shall be closed, the return air damper shall be open. When the fan is on, the minimum outside air damper and return air damper shall be 100% open, the maximum OA damper shall be closed and the static pressure shall modulate the vane axial pitch blade to maintain set supply duct pressure as sense by the duct static pressure sensor, fan shall not start until minimum OA damper and discharge damper have been open by end switches. The discharge air temperature shall modulate the cooling coil control vane to maintain the desired discharge air temperature. OA DAMPER RA DAMPER SA DAMPER CHW MV CLOSED OFF STATUS AHU FAN SHUTDOWN REQUEST FOR EXTENSION
SIPOC Diagram DEFINE SUPPLIER INPUT PROCESS OUTPUT CUSTOMER OAFA-FM Chilled Water Mixed Air Air Filter Fan Motor Cooling Coils Best Practices Heat Transfer Air Flow Water Flow Filtration Efficient Operation of Air Handling Units ADB
CTQ Matrix DEFINE Operating condition of the air handling units High Level Need: Improved and reliable performance Output Unit Output Characteristic ( Big Y ) Efficient Operation Operations definition of process to be measured Conduct performance verification of the capacity of the air handling units C T Q Project Y ( Little Y ) Measure How process will be measured: The units shall be in set to full operating condition. Specification Limits Design capacity of each air handling units in tons (38.6T) Improved capacity of inefficient air handling units to an average of 80% of design or 31 tons Target Air Handling unit capacity less than 31.0 tons . Defect No. of defect opportunities per unit. 1 opportunity for a defect per measurement of improved performance
CTQ Matrix Project Y (Little Y) DEFINE Performance Verification Report Form to Measure the Capacity of Air Handling Unit Air Handling Unit Air Side a. Date b. Fan Number c. Fan Speed d. Pressure drop across filter e. Pressure drop across coil f. Fan suction static pressure g. Fan discharge static pressure h. Fan motor amperage i. Rated motor amperage and voltage rating j. Re-circulating airflow (lps) k. Outside Airflow (lps) l. Outside Air condition/state (DB, WB) m. Return Air condition/state (DB, WB) n. Entering Coil condition/state (DB, WB) o. Leaving Coil condition/state (DB,WB) p. Fan discharge condition/state (DB,WB) NOTE: Report form shall contain the following minimum data. Listings shall include design and actual conditions of each air handling unit (supply, outside air, and re-circulation) and water system. How Process Is Measured Air Handling Unit Air Side a. Record date and time of test b. Outdoor conditions at time of test c. Test and record motor load in amperage d. Fully open all accessories and set the fan at full load f. Measure and record the re-circulated air (lps) g. Measure the design OA (lps) h. Record entering and leaving air thru coil (DB, WB) i. Record the pressure drop across the filter j. Record the pressure drop across the coil Air Handling Unit Water Side a. Open manually the motorized valves full open position b. Set temperature controls so coils are calling for full cooling. c. Record the chilled water supply and return temperature d. Record the chilled water supply/return flow using portable ultrasonic flow meter. e. Record and check the pressure drop across the cooling coil.
Milestone/Timeline DEFINE D M A I C • Define 01 Jan 08 to 8 March 08 • Measure 9 March 08 to31 March 08 • Analyze 01 Apr 08 to 30 April 08 • Improve 01 May 08 to 30 May 08 • Control 01 Jun 08 to 30 Jun 08
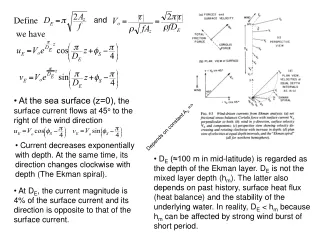
AHU Performance MEASURE Entering Air Temperature RH Velocity Leaving Air Temperature RH Velocity Q = 9.53 xflow(lps)x (h1-h2) Where: Q = capacity in tons of refrigeration (TR) h = enthalpy from psychrometric chart flow = air flow thru coil (lps) Leaving water Temperature Velocity Entering water Temperature Velocity
AHU Performance MEASURE Summary of Measured Parameters of AHUs Less Than 31.0 TR
AHU Performance Summary, Level 1 –Level 8 (Tower Block) MEASURE Capacity Above 31.0 TR CORE 5 (NORTH) CORE 1 CORE 2 (SOUTH) CORE 3 CORE 4 (WEST) CORE 6 (EAST) = 33 Units Capacity Below 31.0 TR = 14 Units Roof deck OSEC Level 9 OGC, OSEC, OPR, SPD & OED Level 8 EDRC, COSO, OREI, PARD & OCO Level 7 SERD & EARD Level 6 SARD, SPRU PSOD Level 5 CWRD & RSOD Level 4 TD, RMU, OGA & CTL Level 3 BPMSD, BPHR, OIST & BPCD Level 2 DER & OAS Level 1 LEGEND: - Capacity Above 31.0 TR - Capacity Below 31.0 TR - EXISTING UNIT - NEW UNIT
Is Data NORMAL MEASURE For Normal Data: P-Value >0.05 Mean is approximately equal to median For this Normality Test: P-value of 0.043 is < 0.05 Mean (27.728) not equal to Median (28.328)
Normality Test MEASURE Data is not in a straight line pattern. The normality test confirms that data is non normal
Process Capability MEASURE Zlt = Ppk x 3 = -0.29 x 3 = -0.87 Zst = Zlt + 1.5 = - 0.87 +1.5 = 0.63 % Defective of 27% or Equivalent PPM/DPMO = 274,523
Process Capability MEASURE
Cause and Effect Diagram ANALYZE Low Chilled Water Flow Low Heat Transfer Rate Chilled Water Distribution Cooling Coil Pressure Drop Pump Balancing Wear and Tear Slime Particulate Accumulation Motorized Valve Piping Strainer Root Causes of Reduced Tonnage of AHUs less than 31TR Cooling Coil Cooling Coil Fan Motor ISO Policy Flattened Fins Preventive Maintenance Spare parts Wear and Tear Schedule Procedure Manpower and Supervision Field devices Duct Pressure Sensor Low Air Flow Best Practices
AHU Parameters, Level 1- Level 8 ANALYZE Summary of AHU Parameters which contributes to the Root Causes of Reduced AHU tonnage below 31.0 TR
ANALYZE Analysis of Root Causes • The root causes of degradation of AHU performance was verified by one time measurement of AHU parameters and using engineering formulas to compare the current data with the manufacturers design data and coupled with the actual physical condition of the AHU components. • Low Heat Transfer Rate at the cooling coil between the mix air and the chilled water by way of heat transfer at the cooling coil was verified by actual physical inspection of the cooling coil and taking pressure drop calculations on and off the coil. • Low Chilled Water Flow observed at the AHU was attributed to the pressure drop at the piping components and verified by actual physical inspection. On the other hand low chilled water attributed to the central chilled water system was verified by measurement of chilled water flow at the risers. • Low Air Flow was verified to have been cause by observed flattening of the cooling coil fins and the presence of particulate accumulation of the fins. • Best Practices – Lack of supervision and training of AC technicians in measuring the AHU parameters before and after servicing and cleaning of AHU shows that improve performance have not been measured and verified to prove their effectiveness.
IMPROVE LOW AIR FLOW LOW HEAT TRANSFER • Calibration of duct static pressure sensor. • Alternative sourcing of critical spare parts. • Comb coil fins as necessary. • Use ISO approved chemical agents. • Evaluate the feasibility of replacing the coil. PERFORMANCE CAPACITY OF AHUs BELOW 31 TR BEST PRACTICES LOW CHILLED WATER FLOW • PM procedures to include measure of AHU parameters before and after service. • Training and supervision • Chilled water balancing. • Clean out pipes, strainers and coil at regular period based on measured parameter
STAKEHOLDER ANALYSIS IMPROVE X : Current level of commitment O : Level of commitment needed
AHU Performance IMPROVE Summary of Measured Parameters After Improvement
AHU Performance Summary After Improvement IMPROVE Capacity Above 31.0 TR CORE 5 (NORTH) CORE 1 CORE 2 (SOUTH) CORE 3 CORE 4 (WEST) CORE 6 (EAST) = 10 Units Capacity Below 31.0 TR = 4 Units Roof deck Level 9 Level 8 Level 7 Level 6 Level 5 Level 4 Level 3 Level 2 Level 1 LEGEND: - Capacity Above 31.0 TR - Capacity Below 31.0 TR - EXISTING UNIT - NEW UNIT
AHU Parameters, Level 1- Level 8 IMPROVE Summary of Measured Parameters Before and After Improvement
Is data NORMAL IMPROVE For Normal Data: P-Value >0.05 Mean is approximately equal to median For this Normality Test: P-value of 0.268 is > 0.05 Mean (32.45)is approximately equal to Median (31.67)
Normality Test IMPROVE Data points are within the confidence interval The normality test confirms that data is normal
Process Capability IMPROVE Zlt = Ppk x 3 = 0.15x 3 = 0.45 Zst = Zlt + 1.5 = 0.45 +1.5 = 1.95 New Process Sigma is equivalent to 2.9% Defective or 28 or 28,716 DPMO Baseline Process Sigma =0.63. Equivalent to Defective of 27% or PPM/DPMO = 274,523
1 Sample t-test CONTROL Ho: mu1 = 31 TR Null Hypothesis: There is no difference between improved performance and the target mean Ha: mu1 is not = 31TR Alternative Hypothesis: There is a difference between the improved performance and the target mean Since P (0.110) > 0.05 (0.000), we will reject Ha and accept Ho Therefore, there is no difference between the improve performance and the target mean One-Sample T: AHU Capacities (TR), Improve Test of mu = 31 vs not = 31 Variable N Mean StDev SE Mean 95% CI T P AHU Capacities ( 14 32.4772 3.2208 0.8608 (30.6176, 34.3368) 1.72 0.110
OLD AHU UNITS CONTROL FEATURES AND CURRENT OPERATING CONDITIONS 1. Vane axial fans provide variable air volume by utilizing controllable pitch blades, the most efficient at that time of installation. Restricted access for cooling coil clean out 2. Very durable and rugged construction makes these units very reliable 3. 4. ASHRAE equipment handbook estimates the mean economic life of 20 years for the cooling coils. 5. Problems on sourcing some maintenance parts (original or replacement increases cost of maintenance
PROPOSED AHU REPLACEMENT CONTROL Newly Installed DAIKIN AHU Units Proven to be Effective With the Following Features: 1. Highly efficient variable speed drives saves 35% of operating cost with an estimated payback of 3 years for these drives. 2. Compact size for ease of installation and maintenance. Advanced performance via digital microprocessor control and serial communications. 3. 4. Latest trends in AHU technology such as provision of ultraviolet germicidal irradiation (UVGI) for cooling coil disinfection can be explored which makes good energy and environmental example.
Control Measure and Guidelines CONTROL
Process Control Plan CONTROL Process Control Plan Monitoring of AHU parameters shall be done every two (2) weeks, beginning at completion of improve phase and taking measurements of parameters thereof to determine the optimum schedule for chemical cleaning which could be quarterly or every six months . However the monthly cleaning using water and detergent shall continue in accordance with the schedule in CMMS.
Control Plan Root Causes CONTROL
I –MR CHART, AHU CAPACITY CONTROL
I –MR CHART,kW RATING CONTROL
I –MR CHART,CHW WATER FLOW CONTROL
I –MR CHART, AIR FLOW CONTROL
I –MR CHART,ENTHALPY CONTROL
Stop Gate Review CONTROL Timeline for Project Commissioning, Project Closeout Meetings and Validate Gate Review Transfer to Process Owner (Commissioning Meeting*) Final Results ReviewMeeting* Sustain (optional) Validate $ Control ongoing “annual improvement” 3 months to improve the rest of older Air Handling Units 12 months Transfer Review Meeting* ** Project Closeout Meeting (Team members) * Meetings that are part of the Project Commissioning Process ** Meeting that is the official end of the Project
Project Benefits CONTROL • HARD AND SOFT SAVINGS • I. Hard Savings • Improve performance of the air handling units resulted in savings of 3.23% in power consumption which translates into annual energy cost savings of USD 7,010.00 • Recover loss capacity of around 17.10 % due to improve performance resulted in a recovery of 66.36 tons of refrigeration (TR) for the 14 units and thereby improving • the overall chilled water plant efficiency. This recovery of additional 66.36 TR translates to an additional annual energy cost savings of USD 1,738.90. • Soft Savings • Improved documentation of current operating condition of air handling unit can be used for future building retrofit or AHU replacement project. • Energy and Resource Conservation initiatives without major costs proven to be effective. • Knowledge and techniques gained can be replicated to improve the operating performance of the components of the air conditioning system such as cooling towers and refrigeration equipment.
Cost Savings CONTROL Summary of AHU Power Consumption Savings After Improvement Reference: 1 US Dollar (USD) = 44.55 Phil. Peso (Php), June 2008
Cost Savings CONTROL kW-HR Savings in Reduced Chilled Water at the Secondary Chilled Water Pump Reference: 1 US Dollar (USD) = 44.55 Phil. Peso (Php), June 2008
Lessons Learned CONTROL • The data driven problem solving approach of Six Sigma enable this complex engineering problem to succeed. • Teamwork and the proper selection of team members with specific functional roles is crucial so that target completion date of each phase of the project can be met following the DMAIC methodology. • Using the Minitab as a tool to analyze data, we were able to document the current operating performance of the air handling units in addition to the standard engineering calculations used to measure performance. • Continuous improvement in AHU performance can be sustained by strategically involving the process owners (AC technicians) in data gathering and analysis and showing them how Six Sigma works to uncover inefficiencies.
Thank you OAFA-FM
ATTACHMENTS • AHU PERFORMANCE VERIFICATION SAMPLE CALCULATION • ESTIMATE kW-HR SAVINGS IN AHU POWER CONSUMPTION OF SAMPLE UNITS • ESTIMATE kW-HR SAVINGS IN AHU POWER CONSUMPTION OF OLD UNITS • ESTIMATE kW-HR SAVINGS DUE TO REDUCED CHILLED WATER FLOW • COMPARISON KW RATING BETWEEN NEW AND OLD UNITS • HEAT TRANSFER PROCESS SHOWN THROUGH PSYCHROMETRIC CHART • CHART OF WATER FLOW VERSUS HEAT TRANSFER RATE • PARETO CHART OF DEFECTS FROM 1992 TO 2008 • MAINTENANCE PARTS (PHOTO)
MEASURE Performance Verification
Estimate KW-HR Savings Of 14 Sample Units MEASURE Savings = (8.04 kw – 7.78 kw) x 14 units x 2929 hours/year = 10,661 kw-hrs Average decrease in kw capacity at full load = (8.04 kw – 7.78 kw) / 8.04 x 100% = 3.23% Savings in Tons of Refrigeration (TR) = (32.47 TR – 27.73 TR) x 14 units = 66.36 TR Average increase in Tons of Refrigeration (TR) at full load = (32.47 TR – 27.73 TR) / 27.73 x 100% = 17.1%
Estimate KW-HR Savings Of 44 Old Units MEASURE Ave. decrease in KW capacity at full load based on 14 samples = 3.23% Estimated savings = .0323 x 9.59 kw x 44 units x 2832 hr/yr = 38,598 kw-hrs