1 / 1

Figure S3.

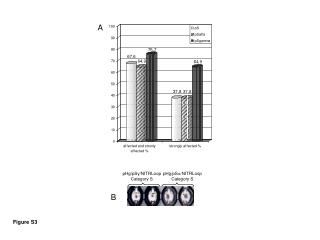
Figure S3. A. nanoKat / mg protein. pH values. B. nanoKat / mg protein. pH values.

zelia
Download Presentation

Figure S3.

An Image/Link below is provided (as is) to download presentation Download Policy: Content on the Website is provided to you AS IS for your information and personal use and may not be sold / licensed / shared on other websites without getting consent from its author. Content is provided to you AS IS for your information and personal use only. Download presentation by click this link. While downloading, if for some reason you are not able to download a presentation, the publisher may have deleted the file from their server. During download, if you can't get a presentation, the file might be deleted by the publisher.

E N D

Presentation Transcript


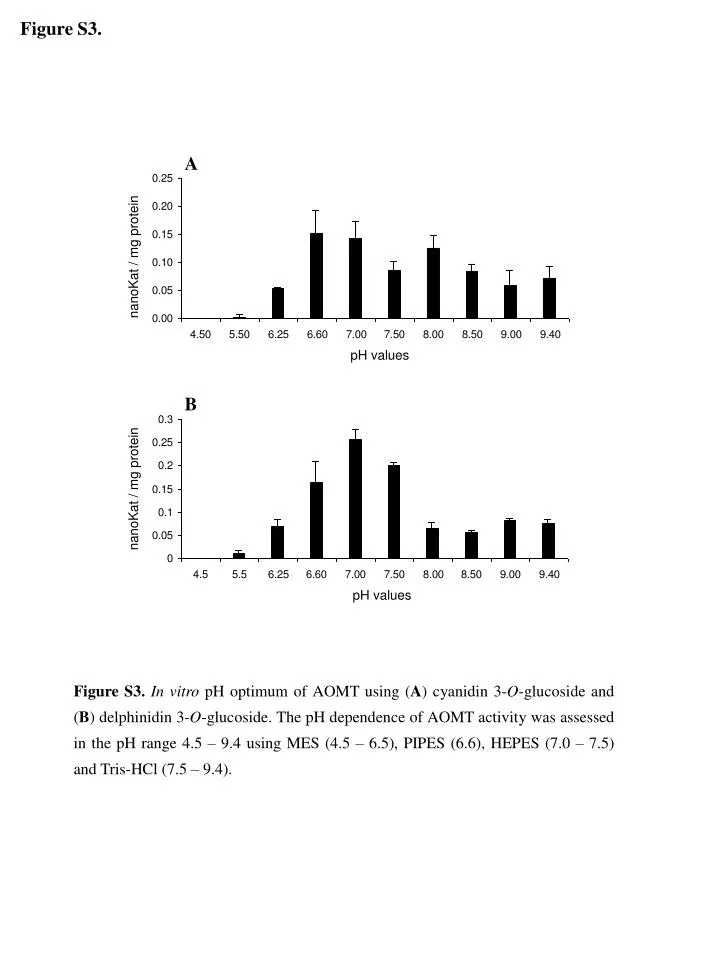
  1. Figure S3. A nanoKat / mg protein pH values B nanoKat / mg protein pH values Figure S3.In vitro pH optimum of AOMT using (A) cyanidin 3-O-glucoside and (B) delphinidin 3-O-glucoside. The pH dependence of AOMT activity was assessed in the pH range 4.5 – 9.4 using MES (4.5 – 6.5), PIPES (6.6), HEPES (7.0 – 7.5) and Tris-HCl (7.5 – 9.4).

More Related