Download
1 / 42
440 likes | 632 Views
Relative Contributions and Impacts of Aquaculture and Capture Fisheries. James H. Tidwell, Ph.D. Kentucky State University And Geoff Allan, Ph.D. New South Wales Fisheries. Tidwell’s Theory of Fisheries Relativity. Fish is man’s most important source of animal protein (FAO 2000).

E N D
Relative Contributions and Impacts of Aquaculture and Capture Fisheries James H. Tidwell, Ph.D. Kentucky State University And Geoff Allan, Ph.D. New South Wales Fisheries
Fish is man’s most important source of animal protein (FAO 2000) • Fish makes the greatest contribution where needed most. Fish as % animal protein North America 10% Africa 17% Asia 26% China 22%
Why? • Not really due to increased rates of consumption • (15-16 kg/person). • Primarily due to population growth. 1.5 MMT additional product each year! World Population Increase
Where does it come from?Only Two Sources-Capture or Culture • Historically – the oceans • About 80% of our foodfish supply comes from ocean capture fisheries. • If we needed more – we just fished harder – longer – or further away.
Today’s Reality The ocean’s bounty is NOT limitless. 50% of ocean fisheries fully exploited. 70% in need of urgent management. (FAO 1999).
What We Have Done? Invest in bigger, faster boats with longer ranges • Invest in new technologies to locate and aggregate the fish • Mace (1997) estimated that the “catching capacity” of the fleet has increased 4-8 X faster than actual catch rates. • Increased outlays and decreasing returns create a financial inertia against reducing fishing pressures.
Why? • Consumer demand drives the system • Not only how much – but what species are targeted
Environmental Costs of Capture Fisheries • Major Issue – By-Catch • Longline fisheries -billfishes – pressures on shark species – slow reproduction and recovery rates. • Trawling technologies for ground fish like flounder-also catch large numbers of skates and rays. Shrimp trawls may kill 10 kg of juvenile finfish for each kg of shrimp
By-Catch • Driven by consumer demand • Other high profile examples • Shrimp and Sea turtles • Tuna and shrimp are #1 and #2 in popularity • Tuna and Dolphins
Current Situation • The ocean can supply only 2/3 of current demand. Significant increases from capture appear biologically unsustainable. • Population growth continues. Demands for fish increases over 1 million tons per year. • Where will almost all future supply increases come from?
Aquaculture is the fastest growing food production activity in the world.
Growth of Aquaculture • With a growth rate of 11% per year – Aquaculture is on a pace to surpass beef production by 2010. Not only how much but where. • Aquaculture is growing 6X faster in developing countries than in developed countries While 80% of beef production is in industrialized nations
Aquaculture Production: Developed vs Developing countries 91% omnivores or filter feeders
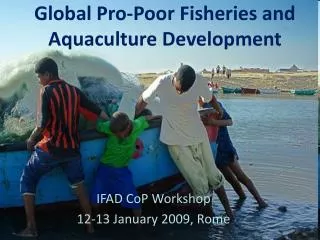
FAO States that: • “As an inexpensive source of highly nutritious animal protein, aquaculture has become an important factor for improving food security, raising nutritional standards, and alleviating poverty, particularly in the world’s poorest countries.”
Food Security • Production already increased 400% between 1984 and 1998. • FAO 2001 predicts significant increases in small-scale aquaculture production in Africa.
There are not too few fish - there are too many people If terrestrialagriculture had not developed, we could never support the current human population. A similar juncture has been reached or passed in fish supplies.
Aquaculture Too Has Its Costs • The very rapid growth of aquaculture has led, in some cases, to environmental impacts and conflicts over limited resources. • You cannot produce 40 Billion kg of anything without leaving an “environmental footprint”. • However, let us base our analyses on facts and fairly compare these impacts to other sources.
Painting with a broad brush. Don’t say aquaculture when discussing one species!! The Down Side ofFish Farming “Aquaculture Industry a failure”, study claims
Shrimp and Salmon = Aquaculture / 9% 6%
Environmental Costs of Aquaculture • Mangrove Destruction • Fact: As much as 50-60% of the historic resource has been lost. • The World Wildlife Fund reported < 5% of mangrove losses due to shrimp farms. Most to urbanization, fuel, pulp…
Issue: Fish Meal in Aquaculture Diets • Naylor et al (2000) reported that aquaculture is “a contributing factor to the collapse of fish stocks worldwide”. • “ever increasing amounts of small pelagic fish would be caught for use in aquaculture feeds”
An analysis of these data indicates no statistical relationship between aquaculture production and pelagic fish landings or fish meal production (P values > 0.80) World Aquaculture Production 35 30 25 World Landings of Pelagic Fish 20 Million Metric Tons 15 el nino 10 World Fishmeal Production 5 0 1984 1985 1986 1987 1988 1989 1990 1991 1992 1993 1994 1995 1996 1997 1998 1999
What has occurred is a market driven reallocation of how this fixed amount is used. 30 MMT
Fish Meal Use vs. Total Production in U.S. Catfish 6.9X Return
Naylor et al pointed out that certain species are “net consumers” of fish. • Specifically salmon and shrimp requiring 3Kg of fish to produce 1Kg of fish on the farm. (actually less) >4X Return
OK- What if we get that same fish from the wild?? 100% 30-35%
Kg of Forage Fish Required to Produce 1 Kg of Salmon or Shrimp KG By-Catch + Wastes Trophic Conversion
Nutrition Research • Just as other livestock industries have reduced fish meal inclusion – so will aquaculture – as nutritional requirements of culture species are identified. Poultry 2 species Aquaculture 167 species
Naylor et al. 1999 – “due to a reliance on fish meal, aquaculture of these species is being subsidized by the marine ecosystem.” • If we source these same products from capture fisheries, they are ENTIRELY “subsidized” by the marine ecosystem.
Species identified as net producers do not convert food to flesh with more metabolic efficiency – They are just subsidized by a different ecosystem – freshwater or terrestrial. These have their own environmental costs
Why is Aquaculture More Efficient? • Less waste – In capture fisheries as much as 40% of the total catch may be wasted or discarded (Howgate 1997). • In aquaculture there is a shorter chain, with more control , from production to harvest to processing and distribution.
Today’s Reality • We need Capture Fisheries AND Aquaculture working together to meet human demand. Soon they must each supply half of the worlds fish supply.
“The divisions between aquaculture and capture fisheries will rapidly fade, and in many regions, have already gone” (Coates 1996). • In Alaska aquaculture is “outlawed” but “wild harvest” salmon and oyster industries rely heavily on aquacultured seedstock.
Rational growth of aquaculture production is necessary to meet basically ALL future increases in the world’s fish supplies. • Simplistic, unbalanced assessments of aquaculture - multiplied through the popular media - can impede responsible aquaculture development.
This could negatively impact food security in regions where high quality protein is needed most. It could actually increase pressures on marine stocks to supply the shortfall.
FAO (2001): • “ Irrespective of whether inaccurate information is generated deliberately to promote a specific cause, or inadvertently through ignorance, it can have a major impact on public opinion and policy making that may not be in the best interest of either sustainable use of fisheries resources or the conservation of aquatic systems.”