Download
1 / 16
160 likes | 302 Views
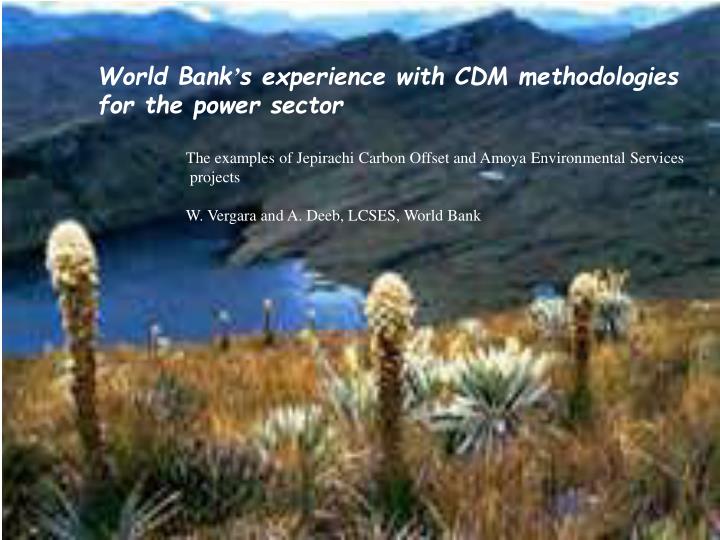
World Bank ’ s experience with CDM methodologies for the power sector. The examples of Jepirachi Carbon Offset and Amoya Environmental Services projects W. Vergara and A. Deeb, LCSES, World Bank. Power sector in Colombia. Installed capacity: 13.000 Mw (65% Hidroenergy)

E N D
World Bank’s experience with CDM methodologies • for the power sector The examples of Jepirachi Carbon Offset and Amoya Environmental Services projects W. Vergara and A. Deeb, LCSES, World Bank
Power sector in Colombia • Installed capacity: 13.000 Mw (65% Hidroenergy) • Generation: 43.000 Gwh per year (75-80% Hidroenergy) • GHG emissions: 6 millions tons C02 (e)/year • The system is managed by the National Dispatch Center – CND, in a competitive dispatch regulation.
CDM projects in Colombia(not just energy generation) • Jepirachi Carbon Offset (20 MW, ERPA for US$3.2M) • Amoya Environmental Services (80 MW, ERPA for E$19M) • Rio Frio Wastewater treatment and GHG abatement (in formulation; CH4, C02,N20) • Furatena Agroindustry energy efficiency (in formulation;C02)
Jepirachi: Carbon Offset Project • First aeolic facility in Colombia, owned and operated by EEPPM (largest local utility, well managed), with 19.5 MW. Inaugurated, January 23, 2004 • Project is seen as providing strategic information for assessment of wind option for power sector • During 2004-2024 the facility is anticipated to displace 1.17 Million tons CO2e, that would otherwise be released from both natural gas and coal based thermal power generating plants.
Local Wayuu Indigenous community: many unmet socialwelfare priorities.
Jepirachi Carbon Off-set project Sustainable Development: --Desalinization plant installed 6 m3/hr --Water storage --Health center (solar powered); --Education facilities
Rio Amoya Environmental Services Project • Run of river unit (no reservoir) • 80 MW 5 million t CO2 e E$80 m investment by ISAGEN & HIDROGER • Paramo ecosystem enables project for: • power generation 568 Gwh/year; • and CO2 reduction in power sector (ca. 5 MMT by 2019)
Amoya environmental services project: Highly bio-diverse ecosystem would be protected: --most civil works underground --access roads to be reverted to natural landscape But also: 10% of carbon revenues go a Paramo Protection Program. …and 10% to a social development program aimed at health, education and sustainable agriculture.
Sustainability cycle for Amoya Environmental Services Project
General guidance on methodologies relating to baselines and monitoring • (i) Elaborate the provisions relating to baseline and monitoring methodologies contained in decision 17/CP.7, …and relevant decisions of the COP/MOP; • (ii) Promote consistency, transparency and predictability; • (iii) Provide rigour to ensure that net reductions in anthropogenic emissions are real and measurable, and an accurate reflection of what has occurred within the project boundary; • (iv) Ensure applicability in different geographical regions and to those project categories which are eligible in accordance with decision 17/CP.7 and relevant decisions of the COP/MOP; • (v) Address the additionality requirement …
Baseline The best tool to represent and estimate the emissions in a conservative and transparent way of the electrical system, is using BL methodologies based on dispatch models, because these tools take into account the real operation (CND uses dispatch model to manage the system). The estimate of emission reductions was made running the model with and without the proposed project.
Additionality • 1) Is the project additional to normal business (or government) practice? • These projects would not have taken place • Without carbon finance; IRRs not attractive, substantial barriers; with cf, sustainable development components are financed (social IRR very high) • 2) Assuming the project is additional, what is the quantity of net ER it causes relative to what would have occurred in the absence of the proposed project?.
OM range: 0.450 to 0.849 tCO2/MWh. BM range: 0.452 to 0.860 tCO2/MWh., therefore CM range: 0.451 to 0.855 tCO2/MWh. OM estimate: 0.116 tCO2/MWh. BM estimate: 0.023 tCO2/MWh., therefore; CM estimate: 0.069 tCO2/MWh Estimated margins vs ACM002 The application of the approved consolidated methodology for the case of Colombia (its application is independent of the project under analysis) produces ER estimates that fall outside the range of the most pessimistic considerations.
Conclusions • High variability of results and the subjective nature of deciding which method to use. • Usefulness of country wide approaches, or grid wide approaches. • High cost, to the CDM project developers, of opting for simplified methods. As compared with the “recommended” estimate OM2 methods –those endorsed by OECD – IEA- results in a regret value of over US$420,000/year.