Download
1 / 38
380 likes | 512 Views
7.1 Review of Graphs and Slopes of Lines. Objective 1 . Plot ordered pairs. Slide 7.1- 2. Plot ordered pairs. Each of the pair of numbers (3, 2), ( 5, 6), and (4, 1) is an example of an ordered pair . An ordered pair is a pair of numbers written within parentheses, consisting

E N D
Objective 1 Plot ordered pairs. Slide 7.1- 2
Plot ordered pairs. Each of the pair of numbers (3, 2), ( 5, 6), and (4, 1) is an example of an ordered pair. An ordered pair is a pair of numbers written within parentheses, consisting of a first component and a second component. We graph an ordered pair by using two perpendicular number lines that intersect at their 0 points, as shown in the plane in the figure to the right. The common 0 point is called the origin. The first number in the ordered pair indicates the position relative to the x-axis, and the second number indicates the position relative to the y-axis. Slide 7.1- 3
Plot ordered pairs. The position of any point in this plane is determined by referring to the horizontal number line, or x-axis, and the vertical number line, or y-axis. The x-axis and the y-axis make up a rectangular (or Cartesian) coordinate system. The four regions of the graph, shown below, are called quadrants I, II, III, and IV, reading counterclockwise from the upper right quadrant. The points on the x-axis and y-axis to not belong to any quadrant. Slide 7.1- 4
Objective 2 Graph lines and find intercepts. Slide 7.1- 5
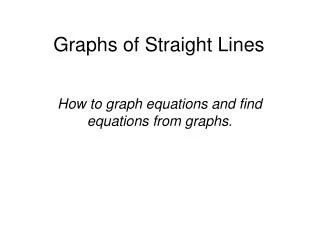
Graph lines and intercepts. The graph of an equationis the set of points corresponding to all ordered pairs that satisfy the equation. It gives a “picture” of the equation. The equation 2x + 3y = 6 is called a first-degree equation, because it has no term with a variable to a power greater than 1. The graph of any first-degree equation in two variables is a straight line. Slide 7.1- 6
Graph lines and intercepts. A straight line is determined if any two different points on a line are known. Finding two different points is enough to graph the line. Two useful points for graphing are called the intercepts. The x-intercept is the point (if any) where the line intersects the x-axis; likewise, the y-interceptis the point (if any) where the line intersects the y-axis. Slide 7.1- 7
While two points, such as the two intercepts are sufficient to graph a straight line, it is a good idea to use a third point to guard against errors. Graph lines and intercepts. Slide 7.1- 8
CLASSROOM EXAMPLE 1 Finding Intercepts Solution: Find the x-and y-intercepts and graph the equation 2x – y = 4. x-intercept: Let y = 0. 2x – 0 = 4 2x = 4 x = 2 (2, 0) y-intercept: Let x = 0. 2(0) – y = 4 –y = 4 y = –4 (0, –4) Slide 7.1- 9
Objective 3 Recognize equations of horizontal and vertical lines and lines passing through the origin. Slide 7.1- 10
Recognize equations of horizontal and vertical lines and lines passing through the origin. A line parallel to the x-axis will not have an x-intercept. Similarly, a line parallel to the y-axis will not have a y-intercept. Slide 7.1- 11
The horizontal line y = 0 is the x-axis. CLASSROOM EXAMPLE 2 Graphing a Horizontal Line Solution: Graph y = 3. Writing y = 3 as 0x + 1y = 3 shows that any value of x, including x = 0, gives y = 3. Since y is always 3, there is no value of x corresponding to y = 0, so the graph has no x-intercepts. The graph y = 3 is a line not a point. Slide 7.1- 12
The vertical line x = 0 is the y-axis. CLASSROOM EXAMPLE 3 Graphing a Vertical Line Solution: Graph x + 2 = 0. 1x + 0y = 2 shows that any value of y, leads to x = 2, makingthe x-intercept (2, 0). No value of y makes x = 0. The graph x + 2 = 0 is not just a point. The graph is a line. Slide 7.1- 13
CLASSROOM EXAMPLE 4 Graphing a Line That Passes through the Origin Solution: Graph 3x y = 0. Find the intercepts. x-intercept: Let y = 0. 3x – 0 = 0 3x = 0 x = 0 y-intercept: Let x = 0. 3(0) – y = 0 –y = 0 y = 0 The x-intercept is (0, 0). The y-intercept is (0, 0). 2nd Pont (1,3) Slide 7.1- 14
Objective 4 Use the midpoint formula. Slide 7.1- 15
Use the midpoint formula. If the coordinates of the endpoints of a line segment are known, then the coordinates of the midpoint (M) of the segment can be found by averaging the coordinates of the endpoints. Slide 7.1- 16
Use the midpoint formula. In the midpoint formula, the small numbers 1 and 2 in the ordered pairs are called subscripts, read as “x-sub-one and y-sub-one.” Slide 7.1- 17
CLASSROOM EXAMPLE 5 Finding the Coordinates of a Midpoint Solution: Find the coordinates of the midpoint of line segment PQ with endpoints P(– 5, 8) and Q(2, 4). Use the midpoint formula with x1= –5, x2 = 2, y1 = 8, and y2 = 4: Slide 7.1- 18
Find the slope of a line. Objective 5 Slide 7.1- 19
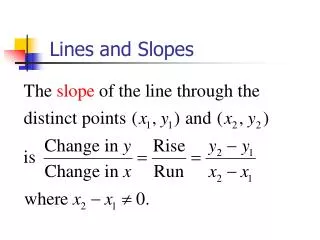
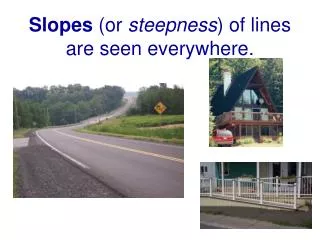
Find the slope of a line. Slope (or steepness) is the ratio of vertical change, or rise, to horizontal change, or run. A simple way to remember this is to think, “Slope is rise over run.” Slide 7.1- 20
The Greek letter delta,Δ, is used in mathematics to denote “change in,” so Δy and Δx represent the change in y and the change in x, respectively. Find the slope of a line. Slide 7.1- 21
Find the slope of the line through points (– 6, 9) and (3, – 5). Thus, the slope is In calculating slope, be careful to subtract the y-values and the x-values in the same order. The change in y is the numerator and the change in x is the denominator. CLASSROOM EXAMPLE 6 Finding the Slope of a Line Solution: If (– 6, 9) = (x1,y1) and (3, –5) = (x2,y2), then Slide 7.1- 22
CLASSROOM EXAMPLE 6 Finding the Slope of a Line (cont’d) If the ordered pairs are interchanged so that (– 6, 9) = (x2,y2), and (3, – 5) = (x1,y1) in the slope formula, the slope is the same. Solution: y-values are in the numerator, x-values are in the denominator. Slide 7.1- 23
Find the slope of the line 3x – 4y = 12. The slope is CLASSROOM EXAMPLE 7 Finding the Slope of a Line Solution: The intercepts can be used as two different points needed to find the slope. Let y = 0 to find that the x-intercept is (4, 0). Then let x = 0 to find that the y-intercept is (0, –3). Use the two points in the slope formula. Slide 7.1- 24
Find the slope of a line. Slide 7.1- 25
Find the slope of the graph of 3x + 4y = 9. The slope is CLASSROOM EXAMPLE 8 Finding the Slope from an Equation Solution: Solve the equation for y. Slide 7.1- 26
Graph a line, given its slope and a point on the line. Objective 6 Slide 7.1- 27
Graph the line passing through (– 3, – 2) that has slope CLASSROOM EXAMPLE 9 Using the Slope and a Point to Graph Lines Solution: Locate the point (–3, –2) on the graph. Use the slope formula to find a second point on the line. (–1, –1) (–3, –2) From (–3, –2), move up 1 and then 2 units to the right to (–1, –1). Draw a line through the two points. Slide 7.1- 28
Graph a line, given its slope and a point on the line. Slide 7.1- 29
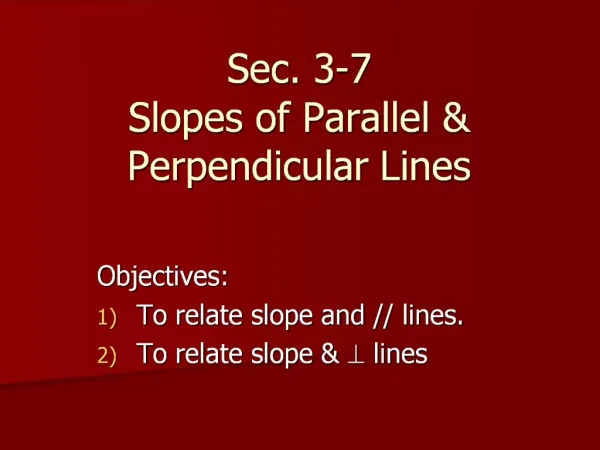
Use slopes to determine whether two lines are parallel, perpendicular, or neither. Objective 7 Slide 7.1- 30
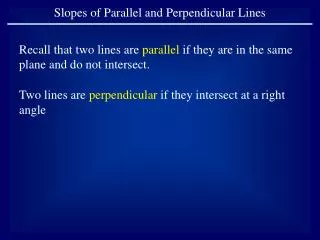
Use slopes to determine whether two lines are parallel, perpendicular, or neither. Slide 7.1- 31
Determine whether the two lines described are parallel,perpendicular, or neither. Line L1, through (–1, 2) and (3, 5), and Line L2, through (4, 7) and (8, 10). CLASSROOM EXAMPLE 10 Determining Whether Two Lines Are Parallel, Perpendicular, or Neither Solution: Line L2 The line through (4, 7) and (8, 10) has slope Line L1 through (–1, 2) and (3, 5) has slope The slopes are the same, so the lines are parallel. Slide 7.1- 32
Determine whether the two lines described are parallel,perpendicular, or neither. The lines with equations y = 2x + 9 and y = – 2x – 3 CLASSROOM EXAMPLE 10 Determining Whether Two Lines Are Parallel, Perpendicular, or Neither (cont’d) Solution: Both equations are already in slope-intercept form. The slopes, 2 and − 2 are not equal so the lines are not parallel. Their slopes are not negative reciprocals, their product is not −1. Thus, the two lines are neither parallel nor perpendicular. Slide 7.1- 33
Determine whether the two lines described are parallel,perpendicular, or neither. The lines with equations 3x + 5y = 6 and 5x – 3y = 2 Since the product of the slopes of the two lines is the lines are perpendicular. CLASSROOM EXAMPLE 10 Determining Whether Two Lines Are Parallel, Perpendicular, or Neither (cont’d) Solution: Find the slope of each line by solving each equation for y. Slide 7.1- 34
Solve problems involving average rate of change. Objective 8 Slide 7.1- 35
Americans spent an average of 886 hr in 2003 watching cable and satellite TV. Using this number for 2003 and the number for 2000 from the graph, find the average rate of change to the nearest tenth of an hour from 2000 to 2003. How does it compare to the average rate of change found in Example 11? CLASSROOM EXAMPLE 11 Interpreting Slope as Average Rate of Change Solution: Slide 7.1- 36
Average rate of change = CLASSROOM EXAMPLE 11 Interpreting Slope as Average Rate of Change (cont’d) A positive slope indicates an increase. The average rate of change from 2000 to 2003 is 65.3 hours per year, which is greater than 58 hours per year from 2000 to 2005 as in Example 11. Slide 7.1- 37
In 2000, 942.5 million compact discs were sold in the United States. In 2006, 614.9 million CDs were sold. Find the average rate of change in CDs sold per year. (Source: Recording Industry Association of America.) CLASSROOM EXAMPLE 12 Interpreting Slope as Average Rate of Change Solution: A negative slope indicates a decrease. Average rate of change = The average rate of change from 2000 to 2006 was –54.6 million CDs per year. Slide 7.1- 38