Download
1 / 2
20 likes | 53 Views
What are Gann? Gann box, Gann fan, TradingView is a platform where you can analyze and understand charts and interact with other traders and their investment ideas. and how to use them? For more information visit https://zerostockbrokerage.com/what-are-gann-indicators-and-how-to-use-them/

E N D
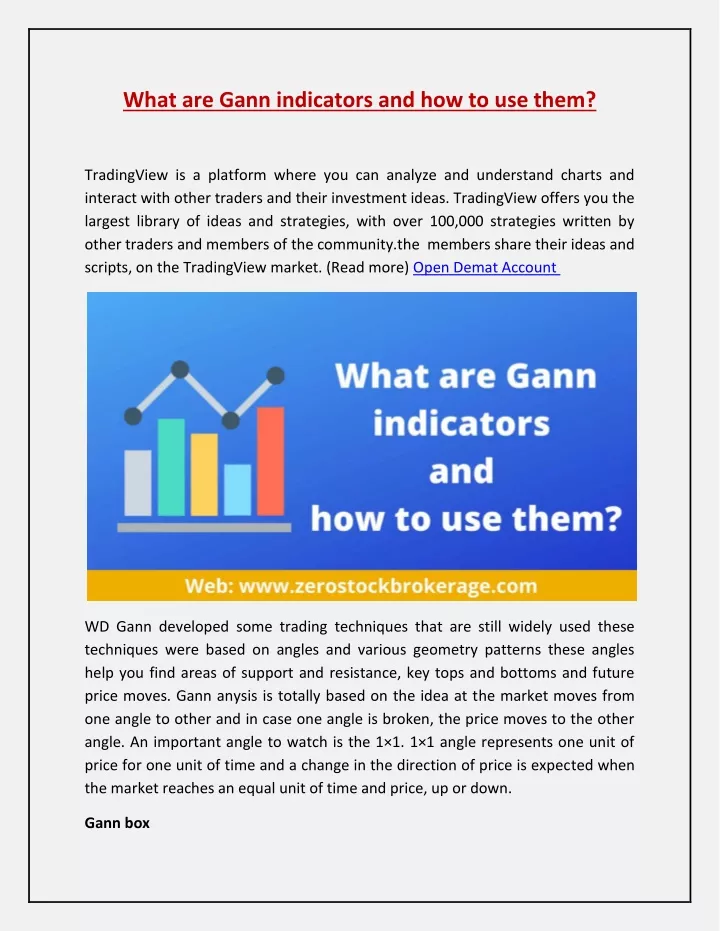
What are Gann indicators and how to use them? TradingView is a platform where you can analyze and understand charts and interact with other traders and their investment ideas. TradingView offers you the largest library of ideas and strategies, with over 100,000 strategies written by other traders and members of the community.the members share their ideas and scripts, on the TradingView market. (Read more) Open Demat Account WD Gann developed some trading techniques that are still widely used these techniques were based on angles and various geometry patterns these angles help you find areas of support and resistance, key tops and bottoms and future price moves. Gann anysis is totally based on the idea at the market moves from one angle to other and in case one angle is broken, the price moves to the other angle. An important angle to watch is the 1×1. 1×1 angle represents one unit of price for one unit of time and a change in the direction of price is expected when the market reaches an equal unit of time and price, up or down. Gann box
Gann box will help you find out recurring price cycles and detect them. If you expect price cycle to repeat, you can set time and price range but before you do that analyse the cchart carefully to ensure the market has a square relationship. The box divides price and time into equal partitions, called price and time levels, and is drawn from a major pivot (either low or high). TradingView allows users to draw the Gann Box on a chart using the smart tools provided. Gann fan Gann fan is basd on the idea of angles and that the market revolves between angles and in case one and breaks,it goes to the next angle. These angles combined together formes a fan. There are 9 diagonal lines (extending indefinitely) designed to show different support and resistance levels. Just like Gann box, Gann fan also helps in predicting areas of support and resistance, key tops and bottoms and future price moves. In the case of a 1×1 angle, which represents one unit of price for one unit of time, a chane in the direction of price is expected. You can draw up to 9 customizable angles on a chart, using TradingView’s smart tool. Ann square Gann Square is an advanced tool based on time and price symmetry and uses the Gann Wheel as a basis for its patterns of price and time. Being an advanced tool it requires basic information and idea about the Gann tools. You can draw the Gann square on a chart using TradingView’s smart tool. Read More: Learn about Trade Ideas with TradingView