Download

1 / 34
350 likes | 497 Views
Feb, 14, 2012. Analysis and Presentation of Cohort Study Data. Hirohide Yokokawa, M.D., Ph.D. Department of General Medicine, Juntendo University School of Medicine. Review of the Cohort study. To determine whether there is an association between a factor and development of a disease.

E N D
Feb, 14, 2012 Analysis and Presentation of Cohort Study Data Hirohide Yokokawa, M.D., Ph.D. Department of General Medicine, Juntendo University School of Medicine
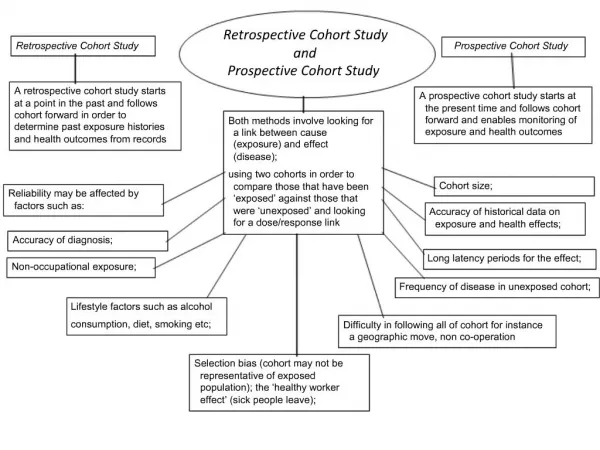
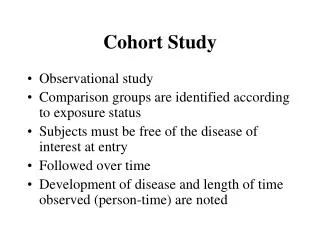
Review of the Cohort study To determine whether there is an association between a factor and development of a disease. To derive an appropriate interference regarding a possible causal relationship.
First step of Analysis in Cohort study data Confirm the distribution and frequency of variables on which you are focusing (Especially outcome data). Check the error data and missing data.
Second step of Analysis in Cohort study data Make a 2 by 2 table Confirm characteristics of subjects with or without disease (outcome).
Third step of Analysis in Cohort study data Select analysis method to estimate factors associated with disease onset (outcome). Discuss results which are computed.
How to analyze Cohort data? There are several methods to analyze Cohort data (Not only one). 2. Odds Ratio (OR) or Hazard Ratio (HR) is used as measure case by case.
An Example of Cohort Study (No use survival data) First Learners
Gaps between hypertension treatment guidelines and practice in Japan Fukushima Research of Hypertension ~(FRESH)~ Hirohide Yokokawa,Aya Goto,Hironobu Sanada, Tsuyoshi Watanabe,Robin A. Felder, Pedro A. Jose, Seiji Yasumura
Introduction of our Cohort study Fukushima Research of Hypertension (FRESH) Research Design Observational Cohort Study (from Sept 2008 to Sept 2011) Subjects Subjects were 1,264 registered hypertensive patients who were received antihypertensive medication by physician members of Fukushima Hypertension Conference.
Aim of the study To determine Success status in achieving goal blood pressures Factors associated with therapeutic failures for target treatment goals among Japanese hypertensive patients (Especially focused on lifestyle characteristics). Fukushima prefecture
Time Course of the Study Baseline 2009-Marchr 1st Follow-up 2009-Septy 2st Follow-up 2010-March 3st Follow-up 2008-Sept Registration 2011-Sept 4st Follow-up Fulfill Registration form and collect basic information Fulfill Follow-up form and collect follow-up data Return these forms by mail
Final Follow up Baseline 2008-Sept Registration 2011-Sept 4st Follow-up BP measurements Prescription change Lifestyle characteristics Lifestyle characteristics Lifestyle characteristics were estimated at Baseline and Final Follow Up only.
Table 1. Median of blood pressures and all survey success rates toward target blood pressure levels
Table 2. An association between total number of healthy lifestyles and blood pressure achievement status Achievement status is better depended on healthy lifestyles during survey period !
The Odds Ratio in Cohort Study Odds in “Poor to Poor” Odds in “Good to Good” a/b c/d = Odds Ratio (OR)=
Table 3. Factors associated with all survey success (logistic regression analyses) Lifestyle change patterns can be evaluated using longitudinal data.
An Example of Cohort Study Survival data analysis (For advanced learners)
Aims To examine and compare the predictive value of total cholesterol (TC), low-density lipoprotein cholesterol (LDL-C), high-density lipoprotein cholesterol (HDL-C), TC/HDL-C and LDL-C/HDL-C ratios for future cardiovascular outcomes in the general Japanese population. Most focused on in the study
Basic method Participant 1 ON SET Participant 2 ON SET Participant 3 Participant 4 ON SET ON SET Participant 5 Participant 6 Participant 7 Participant 8 ON SET ON SET Participant 9 Participant 10 ON SET Registration and collection of basic information Monthly follow up and confirm outcome
Kaplan-Meier Analysis? • In most studies, it is difficult to follow all participants up until death due to lost to follow up, move away, and so on, and follow up time may be different. • A Kaplan-Meier analysis may allow estimation of survival over time, even though lost to follow up are observed.
Hypothetical Study Participant 1 Death Participant 2 Alive Participant 3 Participant 4 Participant 5 Participant 6 Participant 7 Participant 8 Participant 9 Participant 10 1 2 3 4 Year
Hypothetical Study Participant 1 Death Participant 2 Alive Participant 3 Participant 4 Participant 5 Participant 6 Participant 7 Participant 8 Participant 9 Participant 10 Justify the base line of follow-up 1 2 3 4 Year
Hypothetical Study Participant 1 Death Participant 2 Alive Participant 3 Participant 4 Participant 5 Participant 6 Participant 7 Participant 8 Participant 9 Participant 10 1 2 3 4 Year
Survival rate calculation S(0) = p(0) = (10-0)/10 = 1 S(1) = p(0) x p(1) = 1 x (10-2)/10 = 0.800 S(2) = p(0) x p(1) x p(2) = 1 x 0.800 x (7-1)/7 = 0.686 S(3) = p(0) x p(1) x p(2) x p(3) = 1 x 0.800 x 0.686 x (3-1)/3 = 0.457 S(4) = p(0) x p(1) x p(2) x p(3) x p(4) = 1 x 0.800 x 0.686 x 0.457 x (1-1)/1 = 0 Probability at time(0)
Survival curve S(0) S(1) S(2) S(3) S(4) T(0) T(1) T(2) T(3) T(4)
Q4 is significantly different from other quartiles analyzed by “Log rank test”.
Caution! A Kaplan-Meier analysis (Log rank test) is limited to univariate analysis. It is difficult to consider with covariates. Proportional Hazards Model !
What is Proportional Hazards Model ? • A kind of statistical technique for exploring relationship between the survival of a patients and several explanatory variables. • The model can provide an estimation of the treatment effect on survival after adjustment for other explanatory variables.
Hazard Ratio (HR) is used to assess the association It means that the risk of AMI among male participants with a LDL-C/HDL-C ratio of 2.6 or higher was 3.5 times higher compared to other quartiles after adjusting with covariates.