Download
1 / 13
130 likes | 243 Views
catalase. p53. MW(kDa). 170. 130. catalase. 95. PIG3. MW(kDa). 72. 55. 72. 43. 55. 34. 43. 34. 26. Supplementary Figure 1. A. B. Vector PIG3. . 160. . . 140. 120. 100. DCF fluorescence level. 80. 60. 40. 20. 0. H1299. SW480. HCT116 p53 -/-.

E N D
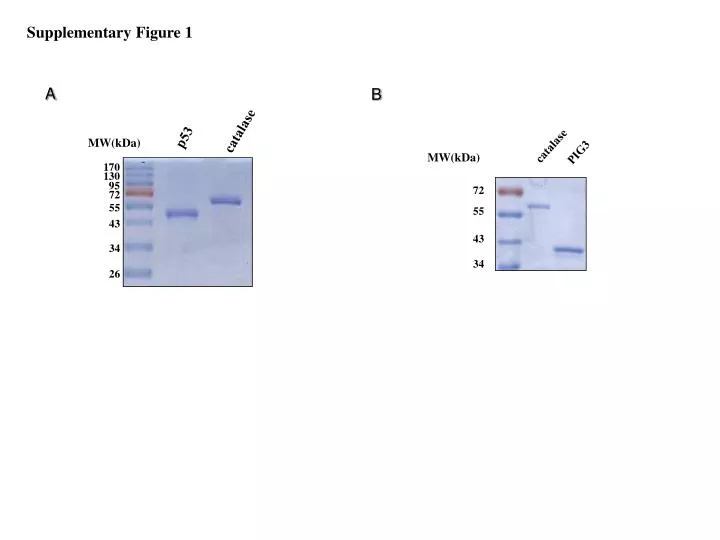
catalase p53 MW(kDa) 170 130 catalase 95 PIG3 MW(kDa) 72 55 72 43 55 34 43 34 26 Supplementary Figure 1 A B
Vector PIG3 160 140 120 100 DCF fluorescence level 80 60 40 20 0 H1299 SW480 HCT116 p53-/- Supplementary Figure 2 A B Vector PIG3 1.4 1.2 1.0 0.8 Catalase activity (U/ml) 0.6 0.4 0.2 0.0 H1299 HCT116 p53-/- SW480 PIG3 catalase -tubulin
catalase Supplementary Figure 3 U2OS RKO HCT116 siRNA Control p53 Control p53 Control p53 p53 p53R2 SESN1 SESN2 GPX1 ALDH4A1 SOD2 TIGAR Nrf-2 TP53INP1 GAPDH
Supplementary Figure 4 UV (10 J/m2) H2O2 (mM) HCT116 p53-/- HCT116 HCT116 p53-/- HCT116 0 4 8 12 24 0 4 8 12 24 (hr) 0 0.05 0.1 1 2 0 0.05 0.1 1 2 p53 p53R2 catalase -tubulin UV (10 J/m2) H2O2 (mM) Saos-2 U2OS Saos-2 U2OS 0 4 8 12 24 0 4 8 12 24 (hr) 0 0.05 0.1 1 2 0 0.05 0.1 1 2 p53 p53R2 catalase -tubulin
catalase p53R2 MW(kDa) 72 55 43 Supplementary Figure 5
n.s. 120 100 80 60 ROS levels (%) 40 20 0 vector wt R2 R4 Supplementary Figure 6 A B n.s. 250 200 150 Catalase activity (%) 100 50 0 vector wt R2 R4
Supplementary Figure 7 B A Control siRNA p53R2 siRNA 160 Control siRNA p53R2 siRNA 140 n.s. 120 1.8 100 1.6 ROS levels (%) 1.4 80 n.s. 1.2 60 1.0 Catalase activity (U/ml) 40 0.8 0.6 20 0.4 0 0.2 HCT116 U2OS RKO 0.0 U2OS RKO HCT116 p53R2 catalase -tubulin
Supplementary Figure 8 Control vector Control vector B A Wild-type p53R2 Wild-type p53R2 Mutant p53R2 (V115L) Mutant p53R2 (V115L) n.s. n.s. n.s. 2.5 120 n.s. n.s. 2.0 100 n.s. 1.5 80 Catalase activity (U/ml) ROS levels (%) 60 1.0 40 0.5 20 0.0 U2OS RKO HCT116 0 p53R2 U2OS RKO HCT116 catalase -tubulin
Supplementary Figure 9 UV (10 J/m2) UT Sup P Sup P p53 PIG3 p53R2 Catalase β-actin PMP70
Supplementary Figure 10 catalase merge DAPI p53 UT p53R2 p53 UV (10 J/m2) p53R2
Supplementary Figure 11 A B U2OS (vector) U2OS (vector) U2OS (catalase) U2OS (catalase) 200 35 180 160 30 140 25 120 Apoptosis (%) ROS levels (%) 20 100 80 15 60 10 40 20 5 0 0 0 8 24 h 0 24 48 h UV (40 J/m2) UV (40 J/m2)
Supplementary Figure 12 H1299 (vector) 180 H1299 (catalase) 160 140 120 ROS levels (%) 100 80 60 40 20 0 Ad p53 0 48 h
Supplementary Figure 13 Untreated control 200 UV (20 J/m2) 180 160 140 120 ROS levels (%) 100 80 60 40 20 0 Vector PIG3 HCT116 p53-/-