Download

1 / 31
310 likes | 328 Views
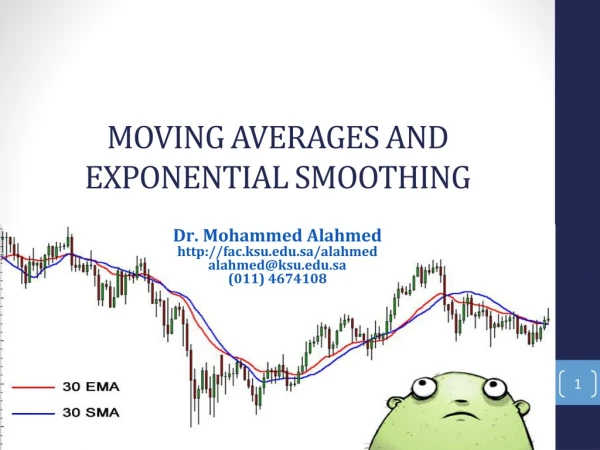
The Power of Moving Averages in Financial Markets. By: Michael Viscuso. Recall…. A Moving Average is the average of the past n days prices. A buy point is signaled when today’s price is above its moving average and yesterday’s price is below its moving average.

E N D
The Power of Moving Averages in Financial Markets By: Michael Viscuso
Recall… • A Moving Average is the average of the past n days prices. • A buy point is signaled when today’s price is above its moving average and yesterday’s price is below its moving average. • A sell point is signaled when today’s price is below its moving average and yesterday’s price was above its moving average
Recall…. (cont.) • We are looking for the best n – the look-back period of the moving average • Small n’s are more responsive to daily changes • Large n’s are less responsive to daily changes • Pros and cons to both
Choosing the best n • Choose which n’s you are going to test • Start with the first 12 months and see which n did best over that time period; record it • Calculate best n for month 13 record the pair • Continue for all months in the data set
Interpreting results • Chi-squared test • Null Hypothesis: No correlation between best n for past year and best n for next month • Alternative Hypothesis: There is a correlation between best n for past year and best n for next month
Interpretation • Using the Chi-Squared formula we obtain a test statistic of 11.838 • Given 9 degrees of freedom this test statistic returns a p-value > alpha = .05 so we do not have enough evidence to reject the Null Hypothesis. Therefore, no correlation.
Where to go from here?? • Suggestions? • Look back
Introduction to Stops • Set a price x percent away from the buy/sell price and if at some future date the price exceeds this stop then sell/buy back • Regular Stops • Trailing Stops • Full Stops • Partial Stops
Picking your stop • One problem has now become two • Pick best n • Pick best stops • Also, different method of solving • Chi-squared cannot be used because expected counts would be too low
Best Attempt • Find best combination since (inception minus a few years) and then test that combination on the years you left out • No worries of expected counts so use as many MAs and %s as you want • List of MAs: 3, 4, 5, 6, 7, 8, 9, 10, 12, 14, 16, 18, 20, 25, 30, 40, 50 • List of %s (top and bottom): 0.0, 0.5, 1.0, 1.5, 2.0, 2.5, 3.0, 3.5, 4.0, 4.5, 5.0
Results of Long Side Trading • Best MA: 3 • Bottom Percent: 0.5% • Top Percent: 1.0% • Percent Correct: 50.157% • MA %APR from 1970-1998: 9.26% • DJIA %APR from 1970-1998: 8.48%
Results of Short Side Trading • Best MA: 3 • Bottom Percent: 0.0% • Top Percent: 0.0% • Percent Correct: 56.326% • MA %APR from 1970-1998: 4.95% • DJIA %APR from 1970-1998: 8.48% • Both Long and Short Side trading together %APR from 1970-1998: 7.66%
Now use these parameters… • Long Side MA %APR from 1998-2003: 5.22% • Short Side MA %APR from 1998-2003: 6.82% • Long and Short Side MA %APR from 1998-2003: 6.03% • DJIA %APR from 1998-2003: 1.07%
Best parameters, Long Side trading • Best MA: 7 • Bottom Percent: 1.0% • Top Percent: 1.5% • Percent Correct: 52.99% • MA %APR from 1998-2003: 10.59%
Best parameters, Short Side trading • Best MA: 18 • Bottom Percent: 1.5% • Top Percent: 2.0% • Percent Correct: 56.92% • MA %APR from 1998-2003: 11.40% • Long and Short Side MA %APR from 1998-2003: 11.00%
Leveraging • Using indicators means you are picking and choosing when to be in or out of the market • Therefore, when you are in you have to make it account for all the times you’re out. • Options are one type of leveraging
Options • Option pricing is difficult because it is dependent upon six factors, only one of which is price • No source of test data • Approximate the amount of leveraging by buying/selling four times as much as your money allows.
The Option Effect • Long Side MA %APR from 1998-2003: 14.14% • Short Side MA %APR from 1998-2003: 24.57% • Long and Short Side MA %APR from 1998-2003: 19.81% • DJIA %APR from 1998-2003: 1.07%
Greedy Perhaps? • 19.81% using the best of the past 28 years vs. 43.06% if you had used the best parameters of the current five years • How do we refine the system to capture more recent advances in other parameters?
First Attempt • Use the best parameters of last year for current year • Result: 20.06% vs. 19.81% • Occurred by Chance?....maybe • Also, the percent correct dropped drastically from 50% to 20% … not good
Second Attempt • Use the best parameters from the past 3 years, 5 years, and 10 years • Results: • 3 years: 13.05% • 5 years: 7.90% • 10 years: 12.74% • Random … not random?
Summary of Results • Back Data: • As much as possible: 19.81% • 10 years: 12.74% • 5 years: 7.90% • 3 years: 13.05% • 1 year: 20.06% • 1 month: 0.49%
Interpretation of 1 month result • Using last month’s best parameters for the next month is essentially chasing yesterday’s fad. • Instead, let’s use a sample of past months to create a lower bound on the expected return for the following month and use the parameters that have the highest lower bound. • How many past months should we use?
Results • Run test on previous five years to determine best number of past months • Best number of past months = 9 • Use this number of past months in choosing which parameters to use for the next month • Result: 0.00% APR • Not any better than 0.49%, however the percent correct, 88.3% (shouldn’t this be around 99%?), was much higher than before
Conclusions • Can we conclude anything? • How well was the moving average able to predict buy/sell points? • By itself… • Using stops • Where was chaotic behavior exhibited? • Moving Average predictions? • Market? • System? • All or none of the above?
Conclusions (cont.) • What amount of Back Data would you use? ... Why? • How much of the results are dependent not upon how much Back Data but the characteristics of that Back Data • How likely is a programming error?