Download
1 / 14
140 likes | 264 Views
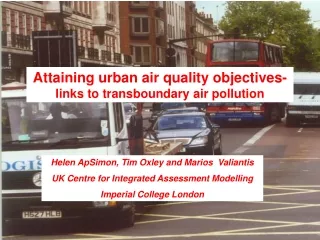
Attaining urban air quality objectives- links to transboundary air pollution. Helen ApSimon, Tim Oxley and Marios Valiantis UK Centre for Integrated Assessment Modelling Imperial College London. CO 2 N2O CH4 C L I M A T E.

E N D
Attaining urban air quality objectives- links to transboundary air pollution Helen ApSimon, Tim Oxley and Marios Valiantis UK Centre for Integrated Assessment Modelling Imperial College London
CO2 N2O CH4 C L I M A T E SOURCES EMISSION EXPOSURE EFFECTS/RECEPTORS Surface waters Energy Sulphur dioxide Sulphur deposition Acidification Terrestial ecosystems Nitrogen deposition Eutrophication Ammonia Marine ecosystems Agriculture NH4 concn Human health SO2,SO4 air concns Industry Nitrogen oxides Materials NO2,NO3 air concns Domestic Crops Yield losses Traffic Ozone VOCs Forests Particles AIR QUALITY PM10/2.5 NO2
Particulate matter PM10: Limit values (max. conc at hot-spots) Annual mean conc. 40 mg.m-3 24 hr conc 50 mg.m -3 < 35 days per year Targets proposed for PM2.5 Limit values 25 mg.m -3 and “exposure reduction”: 20% at urban background sites BENEFITS e.g. in UK 2005 baseline-> £9 to £21 bn/y for life years lost (DEFRA: Air Quality Strategy for England, Scotland, Wales and N Ireland- consultation document April 2006)
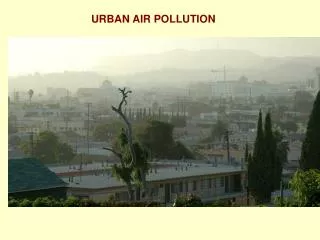
NITROGEN DIOXIDE Limit values: Annual mean conc. 40 mg.m -3 (21 ppb) I hr mean 200 mg.m -3 (105 ppb) <18 times /yr Wide-spread exceedence in European cities, especially at road-side sites. Adds to importance of reducing NOx, but emphasizes urban sources, particularly traffic Illustrate other links to CLRTAP
ASAM- European scale (50km) UKIAM- UK scale (5km) BRUTAL- Background Road & Urban Transport modelling of Air quality Limit Values-> Superimpose road-side on background Road network + traffic data-> traffic emissions individual roads and gridded Pop. Data -> urban areas/roads (canyons etc)
Modelled background concentrations:- First model NOx using same model, PPM, used for primary PM . Then convert to NO2 using relationship between NO2 and NOx NB Good agreement with measurements , but requires added rural background
Background NOx inferred from rural diffusion tube network ->10 mg.m -3 most of England Preliminary calculations suggest that imported NOx contributes to this background including shipping- so some transboundary component. Applies to other countries too?
EMEP source apportionment: relative importance of transboundary and own country: NOx/ NO2 conc. not given by EMEP, but probably more like reduced N deposition and PMcoarse?
SCENARIO ANALYSIS Superimpose roads: Traffic emissions: traffic flows and vehicle mix combined with speed-dependent emission factors (individual roads and summed over grid square) Scenarios: Tech. measures e.g. EGR, early introduction Euro V,VI ; hybrids/LEVs Local measures/ reduced traffic volumes: congestion zones; :LEZs etc.
PRELIMINARY RESULTS Projections of NO2 for 2010 at road-side sites: contributions from roads superimposed in each 1x 1 km grid square on top of background-> mapping of peak concns at hot-spots BAU LEZ Max. tech. reduction case + factors ~CLRTAP -> section across London
BRUTAL (15.5.06): Scenario transects across London for peak NO2 at road-side sites in each grid-cell
NO2 secondary- NO2 primary fraction- evidence depends on O3 of increase - PMtraps NO2 ppb Example: 50 ppb NOx -> 25 ppb NO2 (limit value 21 ppb) Reduce to 35 ppb NOx-> 20 ppb NO2 (OK). BUT! 5 to 20% prim. frac-> 22 ppb NO2; plus more O3 -> 23ppbNO2 (not OK)
Similar analysis PM10 e.g. benefits of PM traps NB importance of non-exhaust emissions- brakes/tyres
Summary: links UAQ and CLRTAP • Local control of urban air quality puts extra emphasis on traffic emissions detailed modelling of scenarios • 2. High economic benefits(PM) • 3. Some direct transboundary contribution to NOx/NO2 ? • 4. NO2-NOx ratios dependent on ozone NB background ozone increasing • 5. Interaction other pollutants- PM trap-> increased primary NO2.