Download

1 / 56
560 likes | 860 Views
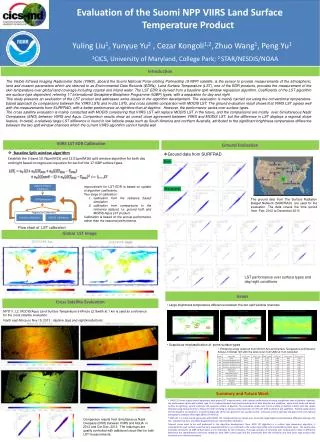
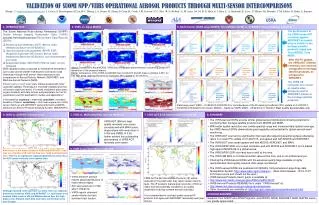
Suomi NPP VIIRS SDR Products Review Meeting. Oct 24, 2012. Lushalan Liao, Calvin Liang, Steve Mills, Tohru Ohnuki, Frank Sun, Stephanie Weiss. Agenda. Overall Objectives of NGAS participation Geolocation and spatial Resolution GEO 2: Encoder analysis (Already presented)

E N D
Suomi NPP VIIRS SDR Products Review Meeting Oct 24, 2012 Lushalan Liao, Calvin Liang, Steve Mills, Tohru Ohnuki, Frank Sun, Stephanie Weiss
Agenda • Overall Objectives of NGAS participation • Geolocation and spatial Resolution • GEO 2: Encoder analysis (Already presented) • GEO 3-9: DNB geolocation accuracy • IMG 4: Image quality (MTF, LSF, HSR, etc) • RAD 17: Band-to-band registration (BBR) • DNB Stray light • IMG 2: Image Analysis (Striping, Glints and Other Artifacts ) • Quality Flags • Dual Gain Anomaly tracking • PTT 2: RDR Histogram Analysis • RAD 25: Dual Gain Anomaly Flagging Verification • RAD 27: Quality Flag Validation and Update
NGAS SDR objectives • VIIRS geometric calibration and validation • Assess encoder stability. • Assess DNB geolocation accuracy and update LUT to correct pointing error as necessary. • Characterize spatial characteristics of the instrument that contribute to radiometry and image quality: line spread function, modulation transfer function, resolution, and BBR. • VIIRS DNB imagery evaluation and enhancement via stray-light removal. • Quality flag evaluation • Work with other team members to resolve sensor and/or algorithm issues. See DR list in the backup section.
Tasks GEO 3-9: Geolocation Accuracy for DNB • Objective • Estimate the accuracy of DNB geolocation base on imagery matching techniques and recommend updates to LUT on as needed basis. • Automatic image matching software was developed: • Uses only control points near sea level (< 50 meters) to alleviate the error induced by the fact the DNB geolocation is not terrain corrected. • GCPs around the Middle East and Australia are used. • Over 16 day period, each GCP is observed across the entire scan angle range. • On one day out of 16, a GCP can be observed from 2 orbits, allowing for comparison of one extreme scan angle with the other extreme scan angle. • Constant angular error at different scan angle results in apparent shift in land features. • Two 16-day periods from May 2, 2002 to June 2, 2002 were used in this study. • Mean scan error of -418 μrad (55 μrad, 1σ) within each 16-day period. We recommend updating LUT to remove this error. This error corresponds to 340 meters at nadir. • Mean track error of <20 μrad (>100 μrad, 1σ) within each 16-day period. • Apparent bias from one scan angle extreme to another of approximately 200 μrad. • DNB geolocation meets criteria for provisional maturity. Error associated with the geolocation algorithm is characterized and uncertainty is quantified. It will meet calibrated and validated status after LUT update to remove the scan direction error and we have at least 1 year of data so that we can characterize the seasonal changes.
Observations of same point from different orbits are used to quantify geolocation error as function of scan angles Gulf of Aqaba, near the town of Aqaba. Scan angles of -45.58 degrees (orbit 2910) and 55.1 degrees (orbit 2909), near end of scan.
Retrieved scan geolocation error as function of scan angle Negative error means observation is to the EAST of ‘truth’ on ascending side of orbit. When looking east (SOS, ascending ) negative altitude targets suffers a west-ward shift due to lack of terrain correction. Error in the scan direction is approximately -418 μrad and constant across scan angle except for GCPID1534. This corresponds to (1.9 km at 55 deg scan angle and 340 meters at nadir) GCPID1534 contains the image of the dead sea and has an altitude -365 meters. The scan angle dependence observed is due to lack of terrain correction in DNB geolocation.
Retrieved track geolocation error as function of scan angle Negative error means observation is to the NORTH of ‘truth’ on ascending side of orbit. Change of sign from SOS to EOS suggests a yaw error. Pitch error would have resulted in the same sign. Error in the track direction is approximately zero (<20 μrad , >100 μrad, 1σ) and has a bias across scan of approximately 200 μrad that is currently unexplained. This corresponds to <0.5 pixel EOS in track direction.
VIIRS DNB data at -45.58 Apparent track offset when viewed at Scan angles of -45.58 degrees (orbit 2910) and 55.1 degrees (orbit 2909). Visual interpretation complicated by different orientation of ground track.
Tasks IMG4: Image Quality • Objective • Evaluate spatial characteristics (HSR for I-bands, MTF for M-bands) of the VIIRS instrument in operational condition. • Spatial characteristics meet criteria for provisional maturity, estimates of HSR for I-bands indicate that the optical system is performing as expected. They will meet calibrated and validated maturity once more statistics is accumulated and detailed study of M-band is also performed.
Slant in edge necessary for deriving edge spread function but also induces error
Scene orientation is corrected in the modeling process Even after correcting for scene orientation, the retrieved HSR from the ‘same’ scene still has an uncertainty of 6% of HSI.
RAD17: Band-to-Band Registration (BBR) • Objective • Evaluate BBR of the VIIRS instrument in operational condition and recommend timing adjustments between focal planes on as needed basis. • Two alternative approaches to derive BBR between bands: • Edge analysis • Mutual Information Maximization • BBR between FPA’s evaluated by studying I1, I3, I4 and I5 which are located on three different focal planes. BBR between different stages of DNB was also evaluated. • BBR meets criteria for provisional maturity. The focal planes are well registered to each other and do not require timing adjustment. The registration between DNB stages are better than 5%.BBR will meet calibrated and validated maturity when M-bands are included in the evaluation to study the effect of plate scale change. Negative numbers means the second band leads the first band. For example, edge analysis indicates I5 sees a particular feature at 7% of I-band HSI before I1 does.
Edge analysis is unreliable due to scene spectral content Comparison of edge location from edge analysis between reflective and emissive bands is difficult due to scene spectral content. In the case of land/water boundary, the shorter visible wavelengths see the bottom surface. This effectively shifts the edge location relative to emissive bands which do not see much beneath the surface .
Mutual Information Maximization (MIM) Mutual information maximization is a statistical technique that seeks to maximize the reduction in uncertainty in one scene given the knowledge of another scene. It can be automated to perform registration such that an associated uncertainty is estimated as part of the process of estimating the registration error.
BBR trend and associated uncertainty using Mutual Information Maximization (MIM) Data from Feb 2012 to July 2012 indicates stable BBR between focal planes with minor upward trend in I1/I4 track registration. All registration offsets are less than 10% of an I-band sampling interval, consistent with pre-launch measurements.
MIM applied to DNB inter-stage registration Near terminator, availability of scenes with both LGS and MGS data allows for inter-stage evaluation. The result indicates that there is nearly zero inter-stage registration error.
Edge Analysis applied to same scenes MGS LGS Edge analysis is complicated by striping and noise. On average, the retrieved error agree with MIM retrieval to within 3%.
DNB Stray Light • IMG 2: Image Analysis (Striping, Glints and Other Artifacts )
DNB Stray Light and its impact on DNB imagery • IMG 2 : Stray light is appearing on the night side of the terminator • Appears for both the southern & northern terminator crossing • Is strongly dependent on detector position, causing stripping • Varies across the entire scan & doesn’t appear to depend on agg. Mode • Is strongly dependent on solar zenith angle at S/C • Is likely dependent on S/C azimuth angle • Stray light changes quite abruptly about 9 minutes from terminator crossing • Affects about 25% of night side.
Methodology for mitigating DNB stray light • We will attempt to enhance the DNB night time data product for scientific investigation by removing as much stray light as possible. • Stray light from sun shining into EV port only (northern & southern hemisphere) • Stray light from sun shining into EV port during penumbra (northern & southern hemisphere) • Stray light from sun shining into EV port and solar diffuser (SD) (southern hemisphere only) • How accurately does stray light need to be corrected? • Current requirement is 0.1Lmin = 3.0x10⁻¹⁰W cm-2sr • Plots have range on log10 gray scale from 2.0x10⁻¹⁰W cm-2sr to 3.0x10⁻⁷W cm-2sr • Current Methodology for Stray Light Correction • Use radiance from terminator crossing close to the new moon, over ocean preferred • Separate scan into even bins across scan and take median of pixels within bin • Eliminate areas where there is significant solar twilight , and remove city lights using masks • Compute cosine of the S/C solar zenith angle • Perform quadratic fit of binned data by cosine of S/C solar zenith angle (fits are performed per bin, per detector, per HAM side) • In twilight regions, extrapolate the stray light estimate taken from the non-twilight regions • Data in bins are interpolated to the full 4064 in-scan pixels • 4th order fit through penumbra • Adjust for nightglow based on darkest parts of granule where there is no stray light
DNB Stray Light Correction Look-Up Tables (LUTs) • Separate LUTs are generated for Northern and Southern hemispheres • Binned by S/C solar zenith angle, detector, frame and HAM side • The correction is applied to the DNB radiances to produce stray light corrected radiances • DNB Stray Light Correction LUTs have a seasonal change • During the hemispheric spring & summer, terminator moves toward equator • Stray light moves away from the pole & into the temperate regions • June & July are in the northern spring& summer • During the hemispheric fall & winter, terminator moves toward pole • Stray light moves to the polar regions & out of the temperate regions • June & July are in the southern fall & winter • Auroras become an issue and granules must be selected based on auroral activity
Atlantic Eastern USA, DNB Stray Light Uncorrected, 07/18/12, 06:43 UTC Log10 (L) Lmin = 3e-9 Spec= 3e-10 07/18/12, 06:43 UTC S. Mills, NGAS
Atlantic Eastern USA, DNB Stray Light corrected , 07/18/12, 06:43 UTC Correction based on 07/19/12 data Log10 (L) Lmin = 3e-9 Spec= 3e-10 07/18/12, 06:43 UTC S. Mills, NGAS
Uncorrected DNB Image from Sept 15, 2012 – Northern Hemisphere, Northwestern Europe
Corrected DNB Image from Sept 15, 2012 – Northern Hemisphere, Northwestern Europe
Uncorrected DNB Image from August 18, 2012 – Northern Hemisphere
Corrected DNB Image from August 18, 2012 – Northern Hemisphere
Uncorrected DNB Image from August 17, 2012 – Southern Hemisphere 32
Corrected DNB Image from August 17, 2012 – Southern Hemisphere
Uncorrected DNB Image from Sept 15, 2012 – Southern Hemisphere
Corrected DNB Image from Sept 15, 2012 – Southern Hemisphere
Conclusions • DNB Stray light is observed to degrade the usefulness of some night time granules. • We have demonstrated a method to correct for stray light that can be implemented in operational system • DNB stray light LUTs should be updated at least monthly • With careful selection of aurora free granules correction is possible in the seasonal winter & fall • Stray light correction will enhance DNB scientific applications and help DNB night time products reach calibrated and validated status. • Observing auroras and clouds in polar regions
Quality Flags RAD 27: Quality Flag Validation and Update Dual Gain Anomaly PTT 2: RDR Histogram Analysis RAD 25: Dual Gain Anomaly Flagging Verification
QF Verification Methodology • Two approaches • Broad QF survey and calculate statistics for all bands over period of times (a few orbits to a few days). The survey generates a list of quality flags and flag combinations that are triggered and the number of times the flags are triggered • Deep dive case studies. Case studies focus on whether flags were correctly triggered and whether the data were appropriately flagged, make recommendations and code updates, as needed • Broad QF survey tool • generate a list of quality flags and flag combinations that are triggered • keep track of the fill values • calculate statistics • keep track of granules in which a particular flag was triggered • Data Set Screened • 20120308: 73 granules, (in 1 orbit) Data Set Screened • 20120308: 73 granules, 39 Day time & 34 night time (in 1 orbit) • 20120318: 73 Granules, 40 day time & 33 night time (in 1 orbit) • 20120402: 309 day time granules • 20120811-13: 952 granules • 20120906-08: 883 granules
VIIRS SDR and SDR GEO Quality Flags • VIIRS SDR quality flags designed to flag data for the 16 moderate resolution bands, 5 imagery resolution bands, and 1 DNB band at • Pixel Level (QF1) • Scan Level (QF2 & QF3) • Scan line level (QF4). DNB has no QF4 • Detector level (QF5). DNB has no QF5 • Each Band has its own set from QF1 to QF5. DNB is from QF1 to QF3 • VIIRS SDR GEO quality flags are designed to flag data at • Scan level (QF1) • Pixel level (QF2) • Each of the SDR GEO files (1 for M bands, 1 for I bands, and 1 for DNB) has its own set QFs • As an example, SDR QF1 definition summary is shown by next chart
VIIRS SDR QF1 (Pixel Level Flags) Definition Summary From NPOESS Common Data Format Control Book – External Volume III – SDR/TDR Formats.
Twelve most commonly observed VIIRS SDR QF1 bit combinations Frank Sun, & Tohru Ohnuki, (NGAS)
Sample QF Survey Summary: 2012 09 06-09 Data, M1 Radiance filled 65529 Bow-tie Deletion Night granules, QF1=18 and QF1=50 adds to the number of radiance filled bins. 23568 scans (491 granules) with no cal data substitution 491 granules with no bad detectors 392 night granules No valid RDR scan data HAMB HAMA Tohru Ohnuki, (NGAS)
Quality Flag examples Band M1 DGA Flags are in exactly the range that is expected in this near terminator scene Band M7 Missing cal data. Scan flagged as poor, but no obvious degradation. Replacement of calibration using other scan was successful Frank Sun, Steve Mills, Tohru Ohnuki, Patty Pratt (NGAS)
Case Study Example: M6 Saturation Rollover Flagging (DR4698) • It was observed from histograms analysis that M6 SDR contains a large amount of saturation rollover data mixed with good data. Many occurrences of saturated (and rolled over) data between blue and red limits in plot on the right. • This discovery led to an operational software change to flag the mixed data region correctly (DR4698). Old flagging upper limit was 49.2 W/m2/sr/mm, new flagging upper limit is 41.2 W/m2/sr/mm. • The code change was delivered and incorporated into operational code (Mx6.3)
Histogram analysis is used to characterize impact of DGA flagging Upper Left: aggregation zone 1, DGA fully flagged, gain state divided. Upper Right: aggregation zone 2. DGA averaged down, gain transition smoothed Lower Left: aggregation zone 3 M1, Detector 3: Histograms. DGA is fully flagged with larger margin, possible over flagged in aggregation zones 2, 3, 4, and 5.
DCR corrected DN is stable • DGA LUT is generated every two month and updated as needed • DGA features’ temporal stability in DCR corrected raw DN space has been studied Frank Sun (NGAS) DGA limits appears to have drifted about 20 DN over time. This is due purely to changes in DCR.
Assessment of QF • Common flags were verified. • There are no major false alarm conditions discovered • See (VIIRS_SDR_QF_Cases_March_21_2012_NG_FrankSun_rev1.pptx) • Cases where calibration substitution occur, appear to be undegraded • Anomalous conditions are usually being properly flagged • Maneuver events are indicated where the granule goes off the earth • Geolocations during maneuvers are properly flagged • Moon in space view is flagged coincident with actual event • Sector rotation and synchronization loss will be properly flagged after Mx6.5. • M6 saturation roll-over flagging: Roll-over data appropriately flagged after code change • Dual Gain Anomaly flagging: DGA fully flagged • DNB stray light flagging: Delivered, to be implemented in Mx6.5 • SDR Quality Flag “Not Used” ” (QF1=XXX3) triggered at two different situations. One is seen from M13 (DR4839 opened) and the other one is seen from DNB (DR not yet opened). • Flag 249 (11111001), representing “Poor Cal, Therm Data Missing, Replacement found, All pix Sat, Both Rad & reflBT out of range”, is also used as fill value (DR not yet opened).
Task GEO2: Encoder Analysis results from telemetry scan PGE running on NSIPS • Encoder Data is valid and stable most of the time • Scan rate appears unchanged since ground testing • Telescope 3.5311 rad/sec, long term deviation approximately 1e-7 • HAM 1.7655 rad/sec, long term deviation approximately 8e-7 • PSD’s are similar to pre-vibe • Exceptions during sync-loss events (see charts xx) when all encoder characteristics behave anomalously. • Current understanding of scan mechanism supports provisional status of SDR’s. Correct flagging of products during scan sync-loss will be implemented for Mx 6.5 which will enable scientists to avoid invalid SDRs when employing the data for scientific investigation.