Download
1 / 1
10 likes | 101 Views
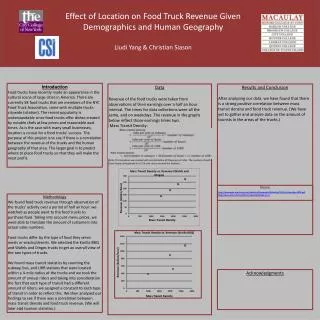
Effect of Location on Food Truck Revenue Given Demographics and Human Geography Liudi Yang & Christian Siason. Introduction

E N D
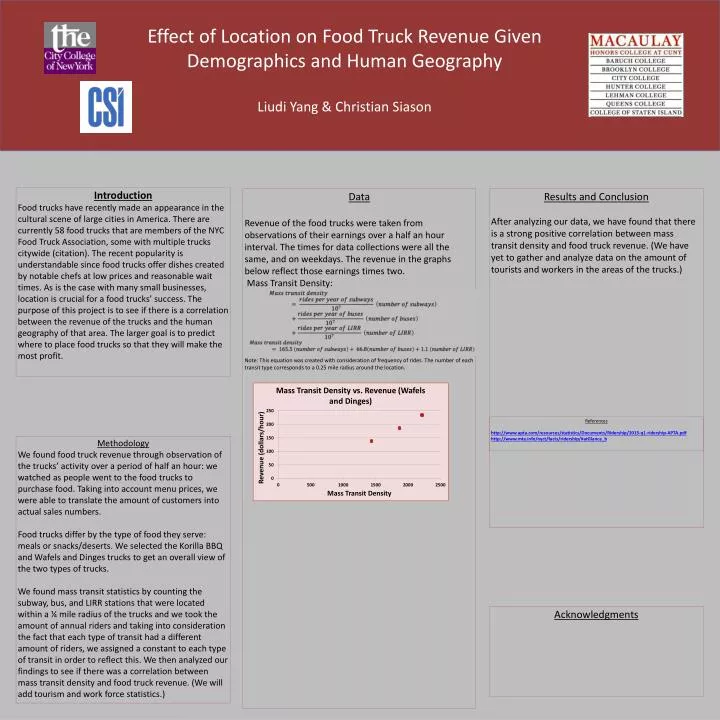
Effect of Location on Food Truck Revenue Given Demographics and Human Geography Liudi Yang & Christian Siason Introduction Food trucks have recently made an appearance in the cultural scene of large cities in America. There are currently 58 food trucks that are members of the NYC Food Truck Association, some with multiple trucks citywide (citation). The recent popularity is understandable since food trucks offer dishes created by notable chefs at low prices and reasonable wait times. As is the case with many small businesses, location is crucial for a food trucks’ success. The purpose of this project is to see if there is a correlation between the revenue of the trucks and the human geography of that area. The larger goal is to predict where to place food trucks so that they will make the most profit. Data Revenue of the food trucks were taken from observations of their earnings over a half an hour interval. The times for data collections were all the same, and on weekdays. The revenue in the graphs below reflect those earnings times two. Mass Transit Density: Note: This equation was created with consideration of frequency of rides. The number of each transit type corresponds to a 0.25 mile radius around the location. Results and Conclusion After analyzing our data, we have found that there is a strong positive correlation between mass transit density and food truck revenue. (We have yet to gather and analyze data on the amount of tourists and workers in the areas of the trucks.) References http://www.apta.com/resources/statistics/Documents/Ridership/2013-q1-ridership-APTA.pdf http://www.mta.info/nyct/facts/ridership/#atGlance_b Methodology We found food truck revenue through observation of the trucks’ activity over a period of half an hour: we watched as people went to the food trucks to purchase food. Taking into account menu prices, we were able to translate the amount of customers into actual sales numbers. Food trucks differ by the type of food they serve: meals or snacks/deserts. We selected the KorillaBBQ and Wafels and Dinges trucks to get an overall view of the two types of trucks. We found mass transit statistics by counting the subway, bus, and LIRR stations that were located within a ¼ mile radius of the trucks and we took the amount of annual riders and taking into consideration the fact that each type of transit had a different amount of riders, we assigned a constant to each type of transit in order to reflect this. We then analyzed our findings to see if there was a correlation between mass transit density and food truck revenue. (We will add tourism and work force statistics.) Acknowledgments