Download
1 / 14
140 likes | 344 Views
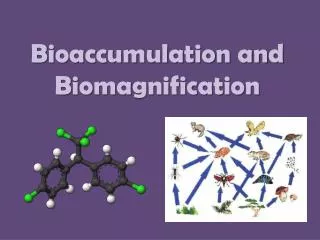
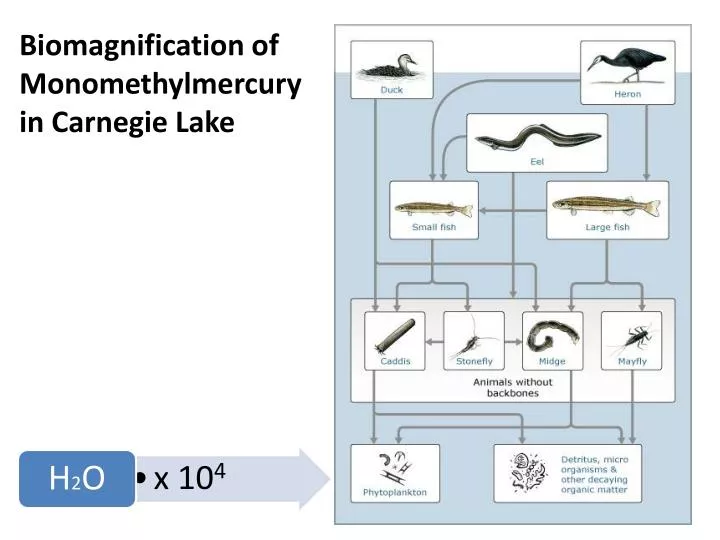
Biomagnification of Monomethylmercury in Carnegie Lake. Are there differences in MMHg uptake for different species of phytoplankton? Which characteristics might be related to increased uptake?. Size Fractioning. Flow Cytometry.

E N D
Are there differences in MMHg uptake for different species of phytoplankton? Which characteristics might be related to increased uptake?
Size Fractioning Flow Cytometry
Within each site: Does the concentration of MMHg increase with increasing trophic level? Clams Amphipods Blood worms Snails
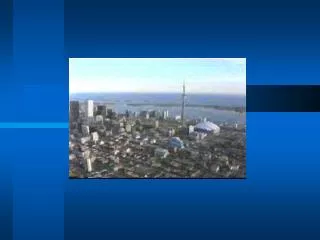
Comparing the 5 sites: Is there a correlation between the density of phytoplankton and the concentration of mercury in the biota? • Phytoplankton density based on fluorescence of chlorophyll (mg of chlorophyll L-1)
High Plankton Densities Reduce Mercury BiomagnificationChen & Folt, 2005
Question: Is there a correlation between the density of phytoplankton and the concentration of MMHg in the biota?
312.4 ppb HgT 705.6 ppb HgT Mean Mercury Concentrations in Freshwater Fish Species Mean concentration (ppb) Bottom Feeders Carp 110 White sucker 110 Channel catfish 90 Predator Fish Largemouth bass 460 Smallmouth bass 340 Walleye 520 Brown trout 140 a EPA National Study of Chemical Residues in Fish 1987; b Concentrations are reported on wet weight basis Source: Bahnick et al., 1994.
Biomagnification of Total Mercury X 8 X 2 X 20,000
Thanks to PEI, Dr. Eileen Zerba, Dr. Francois Morel, Frank Black, NejmaPiagentini, and my fellow interns for all your help this summer!