Download
1 / 63
640 likes | 643 Views
Overdose Deaths 2018. Data for all drug types. Drug Overdose Deaths in Tennessee, 2014-2018. Source: Tennessee Department of Health, Office of Informatics and Analytics. All Drug Overdose Deaths by Race and Sex, 2014-2018.

E N D
Drug Overdose Deaths in Tennessee, 2014-2018 Source: Tennessee Department of Health, Office of Informatics and Analytics
All Drug Overdose Deaths by Race and Sex, 2014-2018 Source: Tennessee Department of Health, Office of Informatics and Analytics
Number of people who died of a drug overdose in Tennessee by contributing substance, 2014-2018 (n= 7,939) Source: Tennessee Department of Health, Office of Informatics and Analytics
Number of people who died of a drug overdose in Tennessee by contributing substance, 2014-2018 (n= 7,939) Rate is per 100,000 persons. Rates & percentages have been rounded to nearest whole number. Source: Tennessee Department of Health, Office of Informatics and Analytics
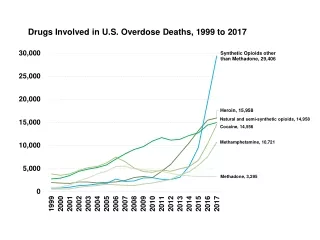
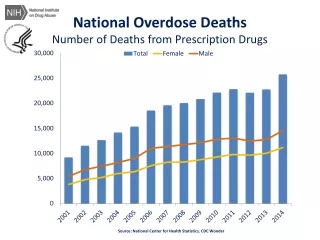
Number of Overdose Deaths in Tennessee by Drug Type, 2014-2018 Source: Tennessee Department of Health, Office of Informatics and Analytics
Deaths by type as a percent of all overdoses, 2014-2018 Source: Tennessee Department of Health, Office of Informatics and Analytics
Trends in overdose deaths by drug type (percent of overdose deaths), 2014-2018 Drug types are not mutually exclusive, so will not sum to 100% Source: Tennessee Department of Health, Office of Informatics and Analytics
Trends in overdose deaths by type (numbers of overdose deaths), 2014-2018 Drug types are not mutually exclusive, so will not sum to overdose death totals Source: Tennessee Department of Health, Office of Informatics and Analytics
All Drug Deaths by Age Distribution, 2014-2018 Source: Tennessee Department of Health, Office of Informatics and Analytics
All Drug Deaths by Age Distribution, 2014-2018 Source: Tennessee Department of Health, Office of Informatics and Analytics
All Drug Deaths by Age Distribution, 2014-2018 Source: Tennessee Department of Health, Office of Informatics and Analytics
Opioid specific data start here Source: Tennessee Department of Health, Office of Informatics and Analytics
All Opioid Overdose Deaths by Race and Sex,2014-2018 Source: Tennessee Department of Health, Office of Informatics and Analytics
Opioids Present In Overdose Deaths, 2014-2018* Percentage of Opioid Overdose Death * Percentages for fentanyl and heroin are included in the opioid category and are broken out for clarity. Source: Tennessee Department of Health, Office of Informatics and Analytics
Opioids Present In Overdose Deaths, 2014-2018* Percentage of Opioid Overdose Death * Percentages for fentanyl, heroin, buprenorphine are included in the opioid category and are broken out for clarity. Source: Tennessee Department of Health, Office of Informatics and Analytics
All Opioid Deaths by Age Distribution, 2014-2018 Source: Tennessee Department of Health, Office of Informatics and Analytics
All Opioid Deaths by Age Distribution, 2014-2018 Source: Tennessee Department of Health, Office of Informatics and Analytics
Pain relievers Source: Tennessee Department of Health, Office of Informatics and Analytics
All Pain Reliever Overdose Deaths by Race and Sex, 2014-2018 Source: Tennessee Department of Health, Office of Informatics and Analytics
Pain Reliever Deaths by Age Distribution, 2014-2018 Source: Tennessee Department of Health, Office of Informatics and Analytics
Pain Reliever Deaths by Age Distribution, 2014-2018 Source: Tennessee Department of Health, Office of Informatics and Analytics
Heroin Source: Tennessee Department of Health, Office of Informatics and Analytics
All Heroin Overdose Deaths by Race and Sex, 2014-2018 Source: Tennessee Department of Health, Office of Informatics and Analytics
All Heroin Deaths by Age Distribution, 2014-2018 Source: Tennessee Department of Health, Office of Informatics and Analytics
All Heroin Deaths by Age Distribution, 2014-2018 Source: Tennessee Department of Health, Office of Informatics and Analytics
Fentanyl Source: Tennessee Department of Health, Office of Informatics and Analytics
All Fentanyl Overdose Deaths by Race and Sex,2014-2018 Source: Tennessee Department of Health, Office of Informatics and Analytics
All Fentanyl Deaths by Age Distribution, 2014-2018 Source: Tennessee Department of Health, Office of Informatics and Analytics
All Fentanyl Deaths by Age Distribution, 2014-2018 Source: Tennessee Department of Health, Office of Informatics and Analytics
Stimulants other than cocaine Source: Tennessee Department of Health, Office of Informatics and Analytics
All Stimulants other than Cocaine Overdose Deaths by Race and Sex, 2014-2018 Source: Tennessee Department of Health, Office of Informatics and Analytics
Stimulants other than Cocaine Deaths by Age Distribution, 2014-2018 Source: Tennessee Department of Health, Office of Informatics and Analytics
Stimulants other than Cocaine Deaths by Age Distribution, 2014-2018 Source: Tennessee Department of Health, Office of Informatics and Analytics
Combination of opioids and stimulants Source: Tennessee Department of Health, Office of Informatics and Analytics
All Opioids plus Stimulant Overdose Deaths by Race and Sex, 2014-2018 Source: Tennessee Department of Health, Office of Informatics and Analytics
Opioid plus Stimulant Deaths by Age Distribution, 2014-2018 Source: Tennessee Department of Health, Office of Informatics and Analytics
Opioid plus Stimulant Deaths by Age Distribution, 2014-2018 Source: Tennessee Department of Health, Office of Informatics and Analytics
Rates (instead of numbers) Source: Tennessee Department of Health, Office of Informatics and Analytics
All Drug Death Rates by Age Distribution, 2014-2018 Rate is per 100,000 persons. Source: Tennessee Department of Health, Office of Informatics and Analytics
All Drug Death Rates by Age Distribution, 2014-2018 Rate is per 100,000 persons. Source: Tennessee Department of Health, Office of Informatics and Analytics
All Opioid Death Rates by Age Distribution, 2014-2018 Rate is per 100,000 persons. Source: Tennessee Department of Health, Office of Informatics and Analytics
All Opioid Death Rates by Age Distribution, 2014-2018 Rate is per 100,000 persons. Source: Tennessee Department of Health, Office of Informatics and Analytics
Pain Reliever Death Rates by Age Distribution, 2014-2018 Rate is per 100,000 persons. Source: Tennessee Department of Health, Office of Informatics and Analytics
All Heroin Death Rates by Age Distribution, 2014-2018 Rate is per 100,000 persons. Source: Tennessee Department of Health, Office of Informatics and Analytics
All Fentanyl Death Rates by Age Distribution, 2014-2018 Rate is per 100,000 persons. Source: Tennessee Department of Health, Office of Informatics and Analytics
All Fentanyl Death Rates by Age Distribution, 2014-2018 Rate is per 100,000 persons. Source: Tennessee Department of Health, Office of Informatics and Analytics