Download
1 / 41
410 likes | 414 Views
This presentation discusses the MINOS experiment, which aims to study neutrino oscillations using the NuMI beam and two magnetized iron-scintillator calorimeters. The results of the experiment confirm neutrino flavor oscillations and provide high statistics discrimination against alternative theories. The talk also covers the search for subdominant oscillations and the study of neutrino interactions and cross-sections.

E N D
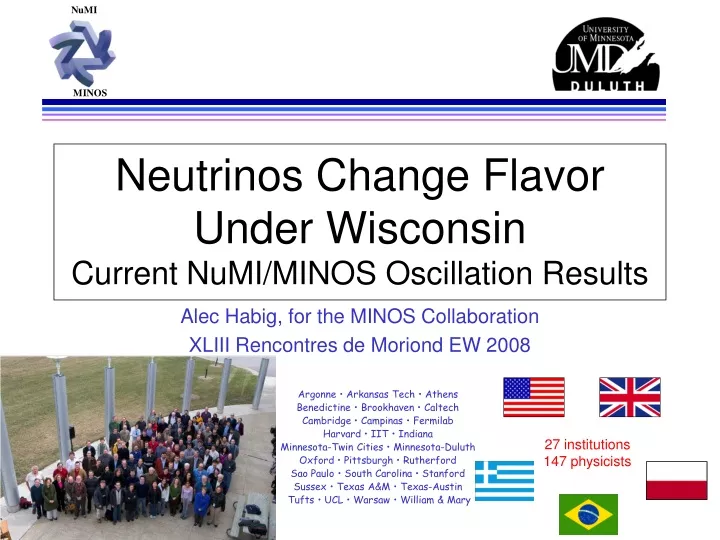
Neutrinos Change FlavorUnder WisconsinCurrent NuMI/MINOS Oscillation Results Alec Habig, for the MINOS Collaboration XLIII Rencontres de Moriond EW 2008 Argonne • Arkansas Tech • Athens Benedictine • Brookhaven • Caltech Cambridge • Campinas • Fermilab Harvard • IIT • Indiana Minnesota-Twin Cities • Minnesota-Duluth Oxford • Pittsburgh • Rutherford Sao Paulo • South Carolina • Stanford Sussex • Texas A&M • Texas-Austin Tufts • UCL • Warsaw • William & Mary 27 institutions 147 physicists
Neutrinos Change FlavorUnder WisconsinCurrent NuMI/MINOS Oscillation Results Alec Habig, for the MINOS Collaboration XLIII Rencontres de Moriond EW 2008 Argonne • Arkansas Tech • Athens Benedictine • Brookhaven • Caltech Cambridge • Campinas • Fermilab Harvard • IIT • Indiana Minnesota-Twin Cities • Minnesota-Duluth Oxford • Pittsburgh • Rutherford Sao Paulo • South Carolina • Stanford Sussex • Texas A&M • Texas-Austin Tufts • UCL • Warsaw • William & Mary 27 institutions 147 physicists
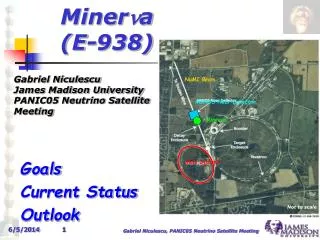
MINOSMain Injector Neutrino Oscillation Search 735 km • Investigate atmospheric sector nm oscillations using intense, well-understood NuMI beam • Two similar magnetized iron-scintillator calorimeters • Near Detector • 980 tons, 1 km from target, 90 m deep • Far Detector • 5400 tons, 735 km away, 700 m deep
Physics Goals This talk Coming later this year Published • Precise (~10%) measurement of Dm223 • Confirm nm↔nt flavor oscillations • Provide high statistics discrimination against alternatives such as sterile n, decoherence, n decay, etc • Search for subdominant nm↔ne oscillations • a shot at measuring q13 • Directly compare n vs n oscillations (a test of CPT) • MINOS is first large underground detector with a magnetic field for m+/m- tagging • Study n interactions and cross sections using the very high statistics Near Detector data set • Cosmic Ray Physics Beam Atmospherics
nm Disappearance Sensitivity Unoscillated Oscillated • Measure nm flux at Near Det, see what’s left at Far Det • Simulated results plotted as F/N ratio • Position of dip gives Dm2 • Depth of dip gives sin22q • Spectral ratio shapes would differ in alternative models Monte Carlo Monte Carlo nmspectrum Spectrum ratio
Far Detector 16 mm • 486 planes, 5400 tons total • Each 1” steel + 1 cm plastic scintillator thick • 8 m diameter with torodial ~1.5 T B-field • 31 m long total, in two 15 m sections • 192 scintillator strips across • Alternating planes orthogonal for stereo readout • Scint. CR veto shield on top/sides • Light extracted from scint. strips by wavelength shifting optical fiber • Both strip ends read out with Hamamatsu M16 PMTs • 8x multiplexed A module of 20 strips 8 fibers on a pixel …on a plane M16 PMT
3D Reconstruction • Take all the “U” view lit-up strips • Cross with all the “V” view lit-up strips • X marks the spot(s) See live events at http://www.soudan.umn.edu
3D Reconstruction • This is a real nm interaction from the beam • m- appears inside detector, • cruises along through many planes, • curving in the magnetic field, • Curvature tells us momentum… • stops. • …so does range See live events at http://www.soudan.umn.edu
Near Detector • 282 planes, 980 tons total • Same 1” steel,1 cm plastic scintillator planar construction, B-field • 3.8x4.5 m, some planes partially instrumented, some fully, some steel only • 16.6 m long total • Light extracted from scint. strips by wavelength shifting optical fiber • One strip ended read out with Hamamatsu M64 PMTs, fast QIE electronics • No multiplexing upstream, 4x multiplexed in spectrometer region 4.8 m 3.8 m n
Caldet Hadronic: 56±2%/E EM: 21±4%/ E • 60-plane ‘micro-MINOS’ • has taken data at T7 & T11 test beam lines at CERN during 2001, 2002, 2003 • Instrumented with both Near and Far Detector electronics • To provide cross-calibrations • Energy uncertainties: 3% relative, and 1.9% (ND) & 3.5% (FD) absolute
NuMI Spectrum • Three standard beam configurations • Obtained by changing target and horn 2 locations • Target easy to move, used to approximate ME, HE with “pME”, “pHE” beams • Horn 2 harder to move, has not yet been adjusted • Can also adjust horn currents for more variations • At L of 735 km andDm2indicated by Super-K, the “Low” energy beam is closest to the first oscillation minima • Unfortunately, also the least intense (still 107nper 1020 pot at the Near Detector!)
Beam Data Analyzed • up to 3x10¹³ protons every 2.2 seconds (~250 kW) (104 events/day in ND!) Higher energy beam RUN I - 1.27x10²⁰ POT(published in PRL) RUN IIa1.23x1020 POT(NEW) RUN IIb~0.75x10²⁰ POT(in can) RUN III>0.63x10²⁰ POT(current) Far Det >99% live! This talk: Run I + Run IIa - 2.497x10²⁰ POT
Near Detector Data • How do data look in the Near Detector, where we have ~unlimited statistics? • If we understand things there, we can then look at the Far Detector data where the physics is happening, so: • Examine ND closely • Compare ND data/MC • “Blind” analysis done ? ? ?
Lots of n in the Near Detector • A mean of 3 n interactions per spill (in 8 or 10 ms), up to 10 • Near Detector Electronics gates for 19 ms during the entire spill • Digitizes continuously every 19 ns, no dead time • Separate events using timing and topology • Below: ~35 x 106 events for 1.27 x 10²⁰ POT image the ND’s internal structure with n! A typical 6-event spill, colored by time
What sort of n Interaction? nm CC Event n n ne e nm m Z W g W p0 g N N 3.5m 1.8m 2.3m X (+X) ne N CC Event X Short, with typical EM shower profile Long m track + hadronic activity at vertex Short event, often diffuse 7 variable log-likelihood PID formed, improves over PRL analysis En = Eshower+Em En = Eshower 22%/E (leptonic) 55%/E 5% range, 10% curvature (hadronic) Monte Carlo NC Event
Reconstructed Beam Spectrum pHE LE-10 pME Discrepancies between data and Fluka05 Beam MC vary with beam setting: so source is due to beam modeling uncertainties rather than cross-section uncertainties MC tuned by fitting to hadronic xF and pT over 7 beam configurations (3 shown here) Weights applied as a function of hadronic xF and pT. LE-10 events MIPP data on MINOS target will be used to refine this in the future, NA49 and Harp results also used
What is Expected in Soudan? p+ to far Detector (stiff) target qf p+ qn (soft) Decay Pipe ND • Measure Near Detector En spectrum • To first order the beam spectra at Soudan is the same as at Fermilab, but: • Small but systematic differences between Near and Far • Use Monte Carlo to correct for energy smearing and acceptance • Use our knowledge of pion decay kinematics and the geometry of our beamline to predict the FD energy spectrum from the measured ND spectrum
On to the Far Detector… • “Blind” analysis • Only after understanding the Near Detector, reconstruction, selected non-oscillation Far Detector parameters, and early pHE (ie, non-oscillating) beam data did we “open the box” • Data “re-blinded” when developing analysis improvements and adding new data
Spectrum |Dm232| = 2.38 +0.20 (stat + syst) x 10-3 eV2 sin22q23 = 1.00 -0.08 (stat + syst) c2/ndf=41.2/34 (18 bins x 2 spectra (Run I, Run IIa) – 2) Measurement errors are 1σ, 1 DOF −0.16
Allowed Region • Fit includes systematic penalty terms • Fit is constrained to physical region: sin2(2q23)≤1 • Consistent with previous experiments • Already best measurement of |Dm232|
The Future MC MINOS MC • nm disappearance • more data, looser cuts as systematics are better understood • add rock muons • Anti-neutrino oscillations • in neutrino beam • anti-neutrino running? • Search for/rule out exotics • Sterile neutrinos • Neutrino decay • Neutrino de-coherence • ne appearance • New sensitivities! Simulated data based on Dm2=2.7x10⁻³ eV2 and sin22q=1.0 (Old values! For Comparison Purposes Only, Dm2 really does = 2.38x10⁻³ eV2 these days, but this plot has not been remade)
Progress Towards the Future • This year should see the first looks at: • A NC analysis to directly test for participation of ns in the nm disappearance • A ne analysis to search for q13 via ne appearance • As with the nm disappearance analysis, the Near Detector data and backgrounds must be well understood before the Far Detector data (and its potential new physics) is examined • Here follow two important steps towards this goal:
Selecting Neutral Current Events • Simple NC event selection: • < 60 planes; • no track or • no track beyond 5 planes from shower
NC Spectrum Projected ns Limits when FD box is opened Real ND NC Data • NC events can be used to search for sterile neutrino component in FD • via disappearance of NC events at FD • FD data coming soon
ne Appearance Sensitivity • Working towards a q13 measurement by using Near Detector data-driven methods to estimate ne appearance backgrounds • At Near Detector, all ne events are background rather than due to ne appearance. • Apply the NN-based ne selection to the ND data to get an all-background sample. • Find what fraction of those background events are NC showers, mis-ID’d CC events, or real ne from the beam • Use these new background estimates to correct Far Detector sensitivity projections for unknowns in hadronic shower modeling etc. • Two independent methods agree • Estimated systematic errors based on these Near Detector studies are 10% • Far Detector sideband studies are next
Muon Removal • “MRCC” sample: • shower only events obtained by removing the muon from CC selected events and reconstructing the shower remnant. • Comes from a well understood spectra, with well known efficiency and purity. • Apply the ne selection to these non-ne events • Results in a background sample of electromagnetic dominated hadronic showers.
Muon Removal • >20% Data/MC discrepancy in both the standard ne and the muon removed CC samples • Comparisons of standard Data and MC shower topological distributions disagree in the same way as does MRCC data with MRCC MC • So MC hadronic shower production/modeling is a major contribution to the disagreement. • Kinematic phase space of MRCC and selected NC events matches well, but MRCC and selected CC events do not. • The MRCC sample is thus used to make and ad-hoc correction to the model to NC events per bin • Beam ne from MC, CC events are the remainder
Horn on/off Method • After applying ne selection cuts to Near Detector data, the composition of the selected events is quite different with the NuMI focusing horns on or off. • Get horn on/off ratios from MC, then solve for NC and CCbackgrounds in bins of energy, get beam ne from the beam MC (a well understood number) • Independent of hadronic modeling Non = NNC + NCC + Ne (1) Noff = rNC*NNC + rCC*NCC + re*Ne (2) from MC: rNC(CC,e) = NNC(CC,e)off/NNC(CC,e)on
Horn on/off Method • On/off ratios match well between data and MC (after fiducial volume cuts). • Apply these fractions to the total data to deconvolute it into its components. • The MC predicts 24% too much CC and 28% too much NC background! • Also checked using 3rdbeam spectrum, pHE rCC rNC Solve eqs. (1), (2) Agrees with Muon Removal method!
Projected q13 Limits • Extrapolating these data-driven backgrounds to the Far Detector, ne appearance limit projections are calculated using the horn on/off method • Shown as a function of CP-violating phase d, since over the MINOS allowed Dm2 range the limits vary little • This plot is for our current exposure, with estimated 10% systematics • Blind analysis in progress
Projected q13 Limits • Projected limits shown for expected MINOS exposures • Data-driven systematics are hoped to drop to 5% with more work plus more horn off data in future years • Inverted hierarchy shown only for lowest exposure for simplicity, but mostly marches along behind the normal limits
Summary • The first 2.51020 POT of NuMI beam data have been analyzed for nmdisappearance oscillations and are consistent with standard neutrino oscillations with the following parameters: • A Neutral Current data spectrum has been measured at the Near Detector. When extrapolated to the Far Detector and compared to data, direct limits on sterile neutrino participation will be set • Studies of Near Detector data are used to establish data-drive backgrounds to ne appearance at the Far Detector. The current MINOS exposure will be sensitive to q13 at the Chooz limit This work was supported by the U.S. Department of Energy, the U..K. Science and Technology Facilities Council, and the State and University of Minnesota. We gratefully acknowledge the Minnesota Department of Natural Resources for allowing us to use the facilities of the Soudan Underground Mine State Park. This researcher was directly supported by NSF RUI grant #0653016.
New Improved Analysis • Several improvements over previous analysis • better reconstruction • improved event separation • improved shower modelling • new intra-nuclear modelling • CC event identification based on • track properties • event length • event kinematics • Derive PID based on PDFs of the above
Improvements • Larger fiducial volume (3%) • improved reconstruction (4%) • improved PID • higher efficiency • higher purity
What Changed? • Improvements: • reco & selection • shower modelling
What Changed? • Improvements: • reco & selection • shower modelling • Data sets: • Pre-shutdown • Post-shutdown
What Changed? • Improvements: • reco & selection • shower modelling • Data sets: • Pre-shutdown • Post-shutdown