Download
1 / 21
220 likes | 407 Views
Displaying Categorical Data. CH. 3 Day 1 Notes AP Statistics EQ: How do we display categorical data? . Warm Up. Identify the W’s, name the variables and specify if it should be treated as categorical or quantitative.

E N D
Displaying Categorical Data CH. 3 Day 1 Notes AP Statistics EQ: How do we display categorical data?
Warm Up Identify the W’s, name the variables and specify if it should be treated as categorical or quantitative. A listing posted by the Arby’s restaurant chain gives, for each of the sandwiches it sells, the type of meat in the sandwich, the number of calories, and the serving size in ounces. The data might be used to assess the nutritional value of the different sandwiches.
Warm Up - Answer • Who (are we studying): Arby’s sandwiches • What(characteristics are we using): • Type of meat (categorical) • number of calories (quantitative) (calories) • serving size (quantitative) (ounces) • When: Not specified • Where: Arby’s restaurants • How: We are using the list posted by the restaurant
Tell whether the variable is categorical, quantitative, or an identifier. Q • Shoe size • VIN number of a car • Number of pages in a book • Class rank • Length of your arm I Q I or C Q
Extra In what way might Age be considered to be a quantitative variable? What about as a categorical variable?
Ways to Represent Data Today we will focus on: Bar Charts Bar Charts Frequency Tables Relative Frequency Tables Pie Charts
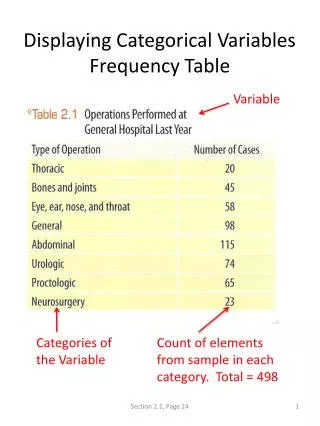
Frequency Tables • Helps organize data • Records totals and categories • Relative frequency table-displays the percentages(proportions) of the values in each category.
Make a frequency table and a relative frequency table of the following averages for previous AP Stats students. 3 .1428 6 .2857 .2857 6 4 .1905 2 .0952
Why make a picture? • It may reveal things you can’t see in the table • It shows important features • It helps you tell about the data to others
Things to Remember… • Context • Appropriate Scale • Area Principle • Label! • Include units where applicable
Make a bar chart of the previous AP Stats averages by letter grade.
Make a relative frequency bar chart of the previous AP Stats averages.
Pie Charts Doesn’t add up to 100% 50% does not look like half Percentages of what whole? Respondents could be in more than one category
Make a pie chart of the previous AP Stats averages. How can we be sure it’s divided proportionally? .1428 .2857 .2857 .1905 .0952
What do we see in the graph? • A should look bigger than F • B and C should look the same • B and C should look twice the size of A • D should appear larger than A • Can approximate areas • Can also use Geometry to calculate Central Angle measures (cross-curricular)
Important Disclaimer: CAN ONLY USE BAR CHARTS AND PIE CHARTS AS LONGS AS INDIVIDUALS BEING STUDIED DO NOT FALL INTO MORE THAN ONE CATEGORY.
The table below gives the distribution by region of the population in the United States in 1996.
Homework p. 36-44 # 5, 7, 8, 10, 11, 13, 14 (due Monday) Reminder: Due tomorrow- 1) p.16 Homework from Textbook 2) Reading Questions Ch.2-3