Download
1 / 5
50 likes | 142 Views
ZoomCharts is offering data visualization tools to support participants at The National Institute for Mathematical and Biological Synthesis’ investigative workshop, Neurobiology of Expertise. The event takes place at the University of Tennessee, in Knoxville, TN 37996, from March 11th through March 13th, 2015. Check out what you can do with ZoomCharts charts and graphs at http://zoomcharts.com ZoomCharts, the world’s most interactive data visualization software, lets you create fully interactive visual representations of big data sets on modern devices at incredibly fast speeds. Be among the growing number of clients in a variety of educational fields discovering the exciting potential that ZoomCharts software tools opens up for analyzing and presenting your data. Organized by Frederick Gregory, Neurophysiology of Cognition, U.S. Army Research Office, and Virginia Pasour, Biomathematics, U.S. Army Research Office, NIMBioS’ workshop will focus on the topic of dynamical neurobiological bases of expert performance. The workshop provides an opportunity for top researchers from diverse fields to share knowledge of multimodal and highly complicated neuroscience datasets. Network sciences and complex systems theory provide an exemplar approach for this analysis. The objectives of the NIMBioS workshop include identifying challenges of mechanistic modeling, prediction, signal processing, and machine learning in order to uncover underlying neural mechanisms. ZoomCharts http://www.zoomcharts.com The world’s most interactive data visualization software

E N D
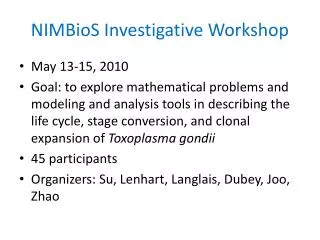
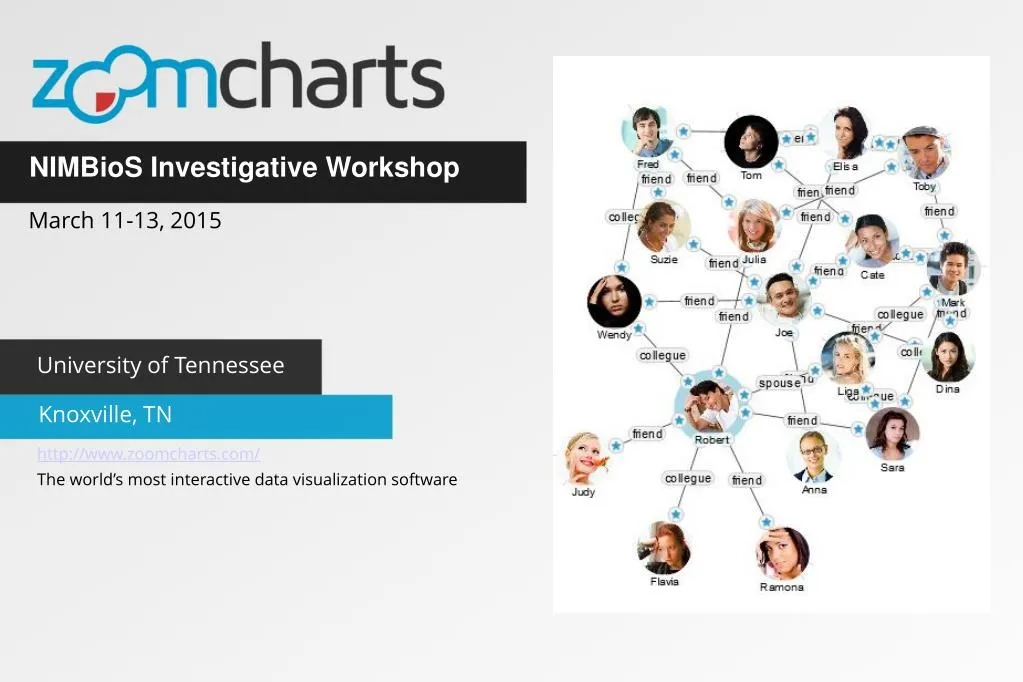
NIMBioS Investigative Workshop March 11-13, 2015 University of Tennessee Knoxville, TN http://www.zoomcharts.com/ The world’s most interactive data visualization software
ZoomCharts For NIMBioS Investigative Workshop March 11-13, 2015 • ZoomCharts is offering data visualization tools to support participants at The National Institute for Mathematical and Biological Synthesis’ investigative workshop, Neurobiology of Expertise. The event takes place at the University of Tennessee, in Knoxville, TN 37996, from March 11th through March 13th, 2015. • Check out what you can do with ZoomCharts charts and graphs at http://zoomcharts.com • ZoomCharts, the world’s most interactive data visualization software, lets you create fully interactive visual representations of big data sets on modern devices at incredibly fast speeds. Be among the growing number of clients in a variety of educational fields discovering the exciting potential that ZoomCharts software tools opens up for analyzing and presenting your data.
ZoomCharts For NIMBioS Investigative Workshop March 11-13, 2015 Organized by Frederick Gregory, Neurophysiology of Cognition, U.S. Army Research Office, and Virginia Pasour, Biomathematics, U.S. Army Research Office, NIMBioS’ workshop will focus on the topic of dynamical neurobiological bases of expert performance. The workshop provides an opportunity for top researchers from diverse fields to share knowledge of multimodal and highly complicated neuroscience datasets. Network sciences and complex systems theory provide an exemplar approach for this analysis. The objectives of the NIMBioS workshop include identifying challenges of mechanistic modeling, prediction, signal processing, and machine learning in order to uncover underlying neural mechanisms.
ZoomCharts For NIMBioS Investigative Workshop March 11-13, 2015
Check out ZoomCharts products: Network Chart Big network exploration Explore linked data sets. Highlight relevant data with dynamic filters and visual styles. Incremental data loading. Exploration with focus nodes. Time Chart Time navigation and exploration tool Browse activity logs, select time ranges. Multiple data series and value axes. Switch between time units. Pie Chart Amazingly intuitive hierarchical data exploration Get quick overview of your data and drill down when necessary. All in a single easy to use chart. Facet Chart Scrollable bar chart with drill-down Compare values side by side and provide easy access to the long tail. ZoomCharts http://www.zoomcharts.com/ The world’s most interactive data visualization software