Download
1 / 6
60 likes | 236 Views
ZoomCharts data visualization tools become very popular amongst government agencies and bureaus because of its capabilities to process large amount of data in a blink of an eye. The user doesn’t have to wait for the data to load and for a chart or graph to update on the screen. The other very important feature is the way how users can interact with the ZoomCharts graphs and charts. You can easily extract data and see how it is related to other entries. Try it yourself! And finally ZoomCharts tools are touchscreen friendly, which means you can use them on your smartphones and tablets. Here is how the Procurement Monitoring Bureau of Latvia has integrated ZoomCharts data visualization tools on their website. About the Procurement Monitoring Bureau The Procurement Monitoring Bureau is a State administrative authority, which monitors the conformity of the state and local government procurement procedures. Fulfilling the duties provided by Law, Procurement Monitoring Bureau is publishing Tender notices and Contract award notices, examining complaints, providing methodological assistance and consultations, compiling and analyzing the statistical information, we have compiled a large amount of information. Check out ZoomCharts products: Network Chart Big network exploration Explore linked data sets. Highlight relevant data with dynamic filters and visual styles. Incremental data loading. Exploration with focus nodes. Time Chart Time navigation and exploration tool Browse activity logs, select time ranges. Multiple data series and value axes. Switch between time units. Pie Chart Amazingly intuitive hierarchical data exploration Get quick overview of your data and drill down when necessary. All in a single easy to use chart. Facet Chart Scrollable bar chart with drill-down Compare values side by side and provide easy access to the long tail. ZoomCharts http://www.zoomcharts.com The world’s most interactive data visualization software

E N D
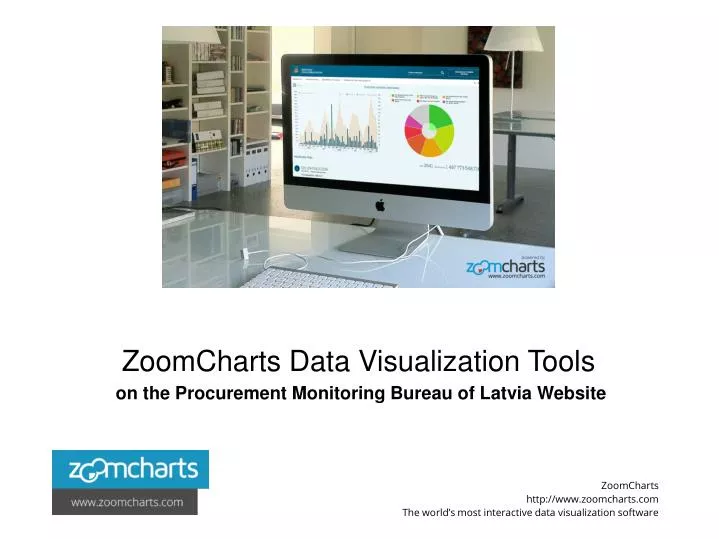
ZoomCharts Data Visualization Tools on the Procurement Monitoring Bureau of Latvia Website ZoomCharts http://www.zoomcharts.com The world’s most interactive data visualization software
ZoomCharts Data Visualization Toolson the Procurement Monitoring Bureau of Latvia Website ZoomCharts data visualization tools become very popular amongst government agencies and bureaus because of its capabilities to process large amount of data in a blink of an eye. The user doesn’t have to wait for the data to load and for a chart or graph to update on the screen. The other very important feature is the way how users can interact with the ZoomCharts graphs and charts. You can easily extract data and see how it is related to other entries. Try it yourself! And finally ZoomCharts tools are touchscreen friendly, which means you can use them on your smartphones and tablets. Here is how the Procurement Monitoring Bureau of Latvia has integrated ZoomCharts data visualization tools on their website. About the Procurement Monitoring Bureau The Procurement Monitoring Bureau is a State administrative authority, which monitors the conformity of the state and local government procurement procedures. Fulfilling the duties provided by Law, Procurement Monitoring Bureau is publishing Tender notices and Contract award notices, examining complaints, providing methodological assistance and consultations, compiling and analyzing the statistical information, we have compiled a large amount of information. ZoomCharts http://www.zoomcharts.com The world’s most interactive data visualization software
ZoomCharts Data Visualization Toolson the Procurement Monitoring Bureau of Latvia Website ZoomCharts http://www.zoomcharts.com The world’s most interactive data visualization software
ZoomCharts Data Visualization Toolson the Procurement Monitoring Bureau of Latvia Website ZoomCharts http://www.zoomcharts.com The world’s most interactive data visualization software
ZoomCharts Data Visualization Toolson the Procurement Monitoring Bureau of Latvia Website ZoomCharts http://www.zoomcharts.com The world’s most interactive data visualization software
ZoomCharts http://www.zoomcharts.com The world’s most interactive data visualization software