Download
1 / 5
50 likes | 125 Views
Midterm Activities: Due by Friday Process Journals must be in YOUR words. Track 2 First finish Tutorial 2, then complete and print process journals for: create a chloropleth map using the layer properties setting visible scale ranges

E N D
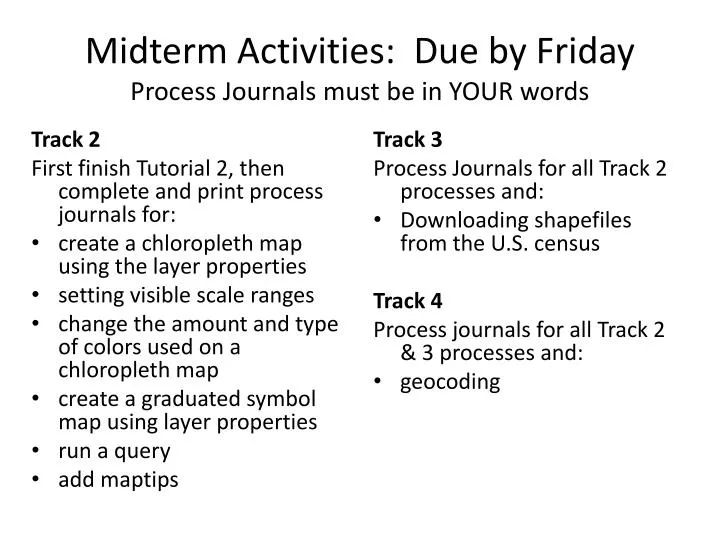
Midterm Activities: Due by FridayProcess Journals must be in YOUR words Track 2 First finish Tutorial 2, then complete and print process journals for: • create a chloropleth map using the layer properties • setting visible scale ranges • change the amount and type of colors used on a chloroplethmap • create a graduated symbol map using layer properties • run a query • add maptips Track 3 Process Journals for all Track 2 processes and: • Downloading shapefiles from the U.S. census Track 4 Process journals for all Track 2 & 3 processes and: • geocoding
Track 2 Midterm Project You will be creating maps to analyze the relationship between cities with large populations and concentrations of minorities. Layers needed from GIS tutorial: States, Counties, cities_dtl Only show cities with a population over 75,000 (query) as graduated shapes Show state outlines only and label with abbreviations (layer properties, labels tab) Need 3 copies of counties showing black, asian, and hispanic populations as chloropleth with 6 different colors Need 3 maps of 3 separate regions showing black population zoomed in to scale of 1:7,000,000
Track 3 Midterm Project You will be creating maps to analyze the relationship between school age population and high schools in Jefferson County You will need to complete geocoding activity 1 in track 7 for week 6 You will add in the following layers for your map: County boundaries from the census website Jefferson county census tracts with DP1 data set up as chloropleth for total population (DP10001) Geocoded Jefferson County High Schools file
Track 4 Midterm Project You will be creating a map to analyze the relationship between access population and the location of major grocery stores. Look up addresses of Kroger stores and Wal-Marts in your assigned zip codes. (see next page) Download Census Tract with DP1 data from census website. Geocode grocery stores and differentiate between Kroger and Walmart
40299, 40291, 40272, 40258, 40245 – Hunter H 40243, 40242, 40241, 40229, 40228 – Hunter B 40223, 40222, 40220, 40218, 40217 - Samantha 40216, 40215, 40214, 40213, 40212 – Tristan 40211, 40210, 40209, 40208, 40207 - Tim 40206, 40205, 40204, 40203, 40202 - Christian 40177, 40118, 40059 - Tiffany