Download

1 / 25
260 likes | 522 Views
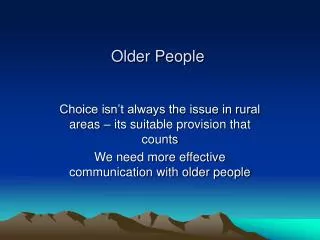
Health Disparities Among Older People. Presentation for Minnesota Gerontological Society Webinar October 19, 2009 LaRhae Knatterud, MAPA. Definition of Health Disparity.

E N D
Health Disparities Among Older People Presentation for Minnesota Gerontological Society Webinar October 19, 2009 LaRhae Knatterud, MAPA
Definition of Health Disparity • “Differences in health status between a defined portion of the population and the majority. Disparities can exist because of socioeconomic status, age, geographic area, gender, race or ethnicity, language, customs and other cultural factors, disability or special health need.” (MN Dept of Health) • There is considerable dispute globally regarding what is avoidable disparities and what is not, e.g., unequal access to clean air and water. U.S. tends not to distinguish between these, and most disparities are considered avoidable.
Factors in Health Disparities • Individual Factors • Age • Genetics • Health behaviors • Chronic illness • Community Factors • Education • Health care access • Community norms • Neighborhoods • System Factors • Health care • Local public health • Social services • Social, economic and health systems
Approach to Measuring Disparity • Most common method is to compare health of one group defined as a reference group with the health of other groups. • Examples of common measures of health disparities for older people are: • Life expectancy • Chronic disease prevalence and incidence rates • Utilization of health care services
Most Frequent Disparities Found • For all ages, including the older population, the most frequent disparities are in health status and health care utilization for elders in ethnic, immigrant and tribal communities. • While these non-white groups of elders are still a small proportion of Minnesota’s 65+ population, they are growing. • Between 2000 and 2030, nonwhite elders will grow from 2% to 7% of 65+ population.
Example of Health Disparity/Not Cancer • Breast cancer mortality rate in Minnesota is 50% higher in black women than in white non-Hispanic women even though the incidence rates are similar. More black women have cancer diagnosed at a later, less treatable stage. Arthritis (Not considered a health disparity) • Risk factors associated with increased risk are not modifiable and include gender, age and genetic predisposition.
Some Specific Disparities in Minnesota’s Older Population
Common Health Disparity Elements • Disease rates • Obesity rates, physical activity rates and tobacco use • Injury rates • Health insurance coverage rates • Health care utilization rates • Rates of mental health impairments (Alzheimer’s)
Fall-related Injuries and Death • By location – MN rural elders are more likely to be hospitalized from falls than urban elderly (48.5% vs 44.44%)* • By gender – 70% of those treated for falls are older women, 30% are older men • By age group - patients aged 75 to 84 years old accounted for the largest proportion of injurious fall-related ED visits among the elderly (40.3 percent), followed by patients 85 years and older (32.4 percent) and patients 65 to 74 years (27.3 percent). • By race - White elders are more likely to experience falls • Housebound status and living alone are risk factors *Deaths from motor vehicle crashes are much higher in rural than urban Minnesota -25.8 vs 17.2 per 100,000
Health Care Access and Use • By location –fewer rural elders say their health is excellent than urban elders (22% vs 27%) • By gender – women use health care more than men (true for all ages) • By age – access and use increase with age • By race – access and use is more limited for nonwhite elders; in Medicaid, there are still access and use issues tied to cultural competence
Health Literacy • By gender – older men are more likely to have health literacy issues than women • By race - up to 20 percent of Spanish-speaking Latinos do not seek medical advice due to language barriers. Asians and Hispanics often report difficulties understanding written information from doctor's offices and instructions on prescription bottles. Up to 40 percent of African-Americans have problems reading • By education – two-thirds of elders 60+ have low to marginal reading skills. Adults with poor literacy are likely to have three times as many prescriptions filled as adults with higher literacy
Rates of Chronic Conditions • By location – MN rural elders had higher mortality rates in all top leading causes of death* than urban elders (926.2 vs 633.6 per 100,000) • By gender – men die at higher rates than women in all leading causes of death • By race – death rates from top leading causes of death are higher for African-American (40% higher for men and 20% higher for women). While death rates for Hispanic, Asian and Indian are lower than these, they experience higher mortality from cancers due to later diagnosis and shorter survival periods. Current and cumulative lifetime exposure to avoidable and unavoidable risk factors and risk behaviors have major impact on poor health outcomes *Heart disease, cancer, stroke, injury and COPD
Alzheimer’s and Related Conditions • Gender – women more likely than men because the live longer than men (16% vs 11% of persons 71+) • Age – prevalence in older age groups is higher. 13% of persons 65+ have Alzheimers, and 50% of those are 85+ • Education – those with <12 yrs of education have 35% greater risk of developing dementia than those with >15 yrs of education • Race – African-Americans are reported to be more likely than whites to have the disease, but further analysis shows that the differences are largely explained by factors other than race Source: http://alz.org/national/documents/report_alzfactsfigures2009.pdf
National and State Resources on Health Disparities of Older People
National Report Card on Healthy Aging • Provides state-by-state report card on 15 indicators of healthy aging • Examples include (and MN rankings are): • health status (lower third in disability) • health behaviors (top in regular physical activity, but lower third in obesity) • Preventive care and screening (best ranked state) • Injuries (lower third)
Minnesota Department of Health Health Promotion and Chronic Disease Division • http://www.health.state.mn.us/divs/hpcd Eliminating Health Disparities Initiative (EHDI) • http://www.health.state.mn.us/ommh Behavioral Risk Factor Surveillance system (BRFSS) • http://www.health.state.mn.us/divs/idepc/diseases/flu/brfssmn.html Statewide Health Improvement Program (SHIP) • http://www.health.state.mn.us/healthreform/ship
University of Minnesota Health Disparities Working Group • http://www.sph.umn.edu/faculty/research/hdwg/training.html • http://www.sph.umn.edu/faculty/research/hdwg/home.html Center on Aging/MN Chair in LTC and Aging • http://www.hpm.umn.edu/coa
Minnesota Board on Aging and Area Agencies on Aging Chronic Disease Self- Management • Partnership with MDH and local public health agencies • Group education of older people at two-hour sessions for six weeks to improve health literacy and provide support as individuals learn better methods for self-management • Collecting data on improvement in health and change in behaviors • Working with older people in ethnic, immigrant and tribal communities
Minnesota Board on Aging andArea Agencies on Aging “A Matter of Balance” • Project to reduce fear of falling and increase behaviors to reduce falling among older people • Partnership between aging and local health networks (and AoA/MBA and MDH) • Trainers in all areas of state, including tribal organizations, to train organizations serving older persons in education and assessment of risk
Minnesota Dept of Human Services Disparities and Barriers to Utilization Among Minnesota Health Care Program Enrollees, describes findings based on a statewide survey of 4,626 enrollees. • About 7% of those surveyed were 65+ enrollees, many of whom are members of ethnic, immigrant and tribal communities. • They reported their main problems with language, culture and religion in the receipt of services, as well as worries that they would not be able to afford services or services would not be covered. • Strategies to address these issues include making programs and related paperwork simpler and less complex to reduce misunderstandings. • http://edocs.dhs.state.mn.us/lfserver/Legacy/DHS-5852-ENG
Minnesota Dept of Human Services • Profiles of elders from ethnic, immigrant and tribal communities enrolled in Minnesota Senior Health Options indicate that less than 50% of elder enrollees speak English, and that they speak 24 non-English languages. • There are many ways that cultural differences require accommodations in how care is delivered, what services are provided or not provided, and how delicate or taboo subjects are discussed.
Minnesota Dept of Human Services Strategies that are successful in increasing access to quality care • Many experts are concluding that the model of health care home is a very effective strategy for providing quality health care to elders in ethnic, immigrant and tribal communities. • It allows key care providers to spend more time with elder and focus on their special needs and their unique cultural/religious situation. • Primary prevention is effective strategy for whole populations.
Hennepin County SHAPE • SHAPE is a series of surveys collecting information on the health of Hennepin County residents and factors that affect it. More than 10,000 households in the county participated in the SHAPE 2006 survey, providing information on 8,000 adults and 4,000 children. • SHAPE is a project of the Hennepin County Human Services and Public Health Department, with University of Minnesota. • Interactive Adult Data Book is online and provide cross tabs on results by 10 small geographic areas in the county and for selected racial and ethnic groups. • Data is available for 1998, 2002 and 2006 surveys. • http://www.co.hennepin.mn.us and search for SHAPE.
Conclusions • The most important determinant of health is environmental conditions, followed by lifestyle. • Medical care ranks third as a determinant of health. • The chief underlying cause of health disparities is increasingly understood to be social and economic inequality; i.e., social bias, racism, limited education, poverty, and related environmental conditions that either directly produce ill health or promote unhealthy behaviors that lead to poor health. • In order to reduce the occurrence of health disparities, instead of just treating already high rates of disease, preventive action must also occur at the systems level.