Download

1 / 85
860 likes | 962 Views
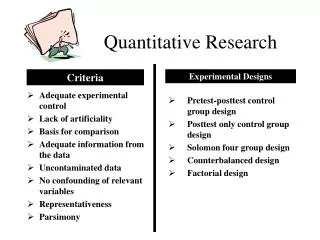
Week 6 ETEC 668 Quantitative Research in Educational Technology. Dr . Seungoh Paek February 19, 2014. Tonight’s Agenda. Introduction to RStudio Continuing with SPSS Cross-tabulation & Measures of Association for Nominal & Ordinal Variables Chi-Square & Other Nonparametric Tests

E N D
Week 6 ETEC 668 Quantitative Research in Educational Technology Dr. Seungoh Paek February 19, 2014
Tonight’s Agenda • Introduction to RStudio • Continuing with SPSS • Cross-tabulation & Measures of Association for Nominal & Ordinal Variables • Chi-Square & Other Nonparametric Tests • Introduction to Akamai Scenario • Group Discussion for Research Paper
Agenda • Determining Research Design • Breakout into Teams • Cross-tabulation & Measures of Association for Nominal & Ordinal Variables • Chi-Square & Other Nonparametric Tests • PSPP
R • R is a free software environment for statistical computing and graphics.
Function f(x) = y
RStudio • RStudio is a free and open source integrated development environment (IDE) for R, a programming language for statistical computing and graphics.
Review of Week 5 • Probability • Samples and Populations • The Normal Curve • Z-Score • Hypothesis (Null Hypothesis vs. Research Hypothesis) • Hypothesis Testing
Hypothesis Testing • All events have a probability associated with them • p = your guess of chance p < .05 • .05 or 5% in Education and Psychology • 5% likelihood of results occurring by chance alone
Error types • Type I • Reject H0 when you should not • Type II • Fail to reject H0 when you should
Which error is better? • NASA engineers examine an electronic circuit. • A criminal court makes a decision as to whether or not Person A is guilty of murder.
Statistical • Based on probability • Research was technically successful • H0 was rejected • P value • Education p < .05 = 5% chance • Medical p < .01 or .001 = 1% or .1% chance
Practical • Does it mean anything to the population? • Is that new treatment worth the cost? • Are my students really doing that much better?
Research Questions in Qualitative Research • Preferred when little is known about a phenomenon • Used when previous studies report conflicting results • Used to describe phenomena
Research Hypotheses for Quantitative Research • Educated guess or presumption based on literature • States the nature of the relationship between two or more variables • Predicts the research outcome • Research study designed to test the relationship described in the hypothesis
Null Hypotheses • Implicit complementary statement to the research hypothesis • States no relationship/difference exists between variables • Statistical test performed on the null • Assumed to be true until support for the research hypothesis is demonstrated
Alternative Hypotheses • Directional hypothesis • Precise statement indicating the nature and direction of the relationship/difference between variables • Nondirectional hypothesis • States only that relationship/difference will occur
Assessing Hypotheses • Simply stated? • Single sentence? • At least two variables? • Variables clearly stated? • Is the relationship/difference precisely stated? • Testable?
Types of Variables • Variable • Element that is identified in the hypothesis or research question • Property or characteristic of people or things that varies in quality or magnitude • Must be identified as independent or dependent
Independent Variables (IV) • Manipulation or variation of this variable is the cause of change in other variables • Technically, independent variable is the term reserved for experimental studies • Also called antecedent variable, experimental variable, treatment variable, causal variable, predictor variable
Dependent Variables (DV) • The variable of primary interest • Research question/hypothesis describes, explains, or predicts changes in it • The variable that is influenced or changed by the independent variable • In non-experimental research, also called criterion variable, outcome variable
Intervening or Mediating Variables • Intervening/Mediating variable • Presumed to explain or provide a link between independent and dependent variables • Relationship between the IV and DV can only be explained when the intervening variable is present • E.g. effect of study prep on test scores • Organization of study ideas into a framework (intervening/mediating)
Control Variables • Special type of IV that can potentially influence the DV • Use statistical procedures (e.g. analysis covariance) to control for these variables • May be demographic or personal variables that need to be “controlled” so that true influence of IV on DV can be determined
Confounding Variables • Confounding variable • Confuses or obscures the effect of independent on dependent • Makes it difficult to isolate the effects of the independent variable • Typically cannot be directly measured or observed • Researchers comment on the influence after study is completed
Relationship Between Independent and Dependent Variables • Cannot specify independent variables without specifying dependent variables • Number of independent and dependent variables depends on the nature and complexity of the study • The number and type of variables dictates which statistical test will be used
Model for Writing Descriptive Questions & Hypotheses • Identify IV, DV & any intervening/moderating variables • Specify descriptive questions for each IV, DV & intervening variable • Write inferential questions that relate variables or compare groups
Scenario • A researcher wants to study the relationship of critical thinking skills to student achievement in science classes for 8th-graders in a large metropolitan school district. The researcher controls for the effects of prior grades in science classes and parents’ educational attainment.
Step 1: Identify variables • What is the IV?
Step 1: Identify variables • What is the IV? • Critical thinking skills (measured on an instrument)
Step 1: Identify variables • What is the DV?
Step 1: Identify variables • What is the DV? • Student achievement (measured by grades)
Step 1: Identify variables • What are the control variables?
Step 1: Identify variables • What are the control variables? • Prior grades in science class • Educational attainment of parents
Descriptive Questions • How do the students rate on critical thinking skills? • What are the students’ achievement grades in science classes? • What are the students’ prior grades in science classes? • What is the educational attainment of the parents of the 8th graders?
Inferential Questions • Does critical thinking ability relate to student achievement? • Does critical thinking ability relate to student achievement, controlling for the effects of prior grades in science and the educational attainment of the 8th-graders’ parents?
Cross-tabulation & Measures of Association for Nominal & Ordinal Variables
Cross-tabulation • Thus far, weʻve looked at univariate stats • Descriptive stats - summarizes the distribution of a single variable (central tendency/dispersion) • Time for bivariate analysis of nominal/ordinal variables - explore relationship between two categorical variables • Cross-tab – a table or matrix that shows the distribution of one variable for each category of a second variable
Let’s investigate • What’s the relationship between race (race) & view on capital punishment/death penalty for murder (cappun)?
SPSS commands • Open “DEMO.sav” file • Analyze → Descriptive Statistics → Crosstab
Recommendation: • Choose IV as column variable (race) • Select DV as row variable (cappun)