Download
1 / 1

E N D
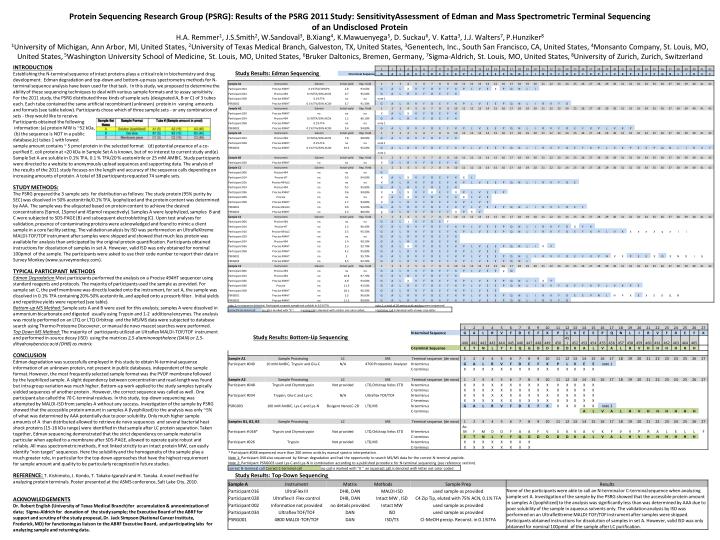
INTRODUCTION Establishing the N-terminal sequence of intact proteins plays a critical role in biochemistry and drug development. Edman degradation and top-down and bottom-up mass spectrometry methods for N-terminal sequence analysis have been used for that task. In this study, we proposed to determine the ability of these sequencing techniques to deal with various sample formats and to assay sensitivity. For the 2011 study, the PSRG distributed three kinds of sample sets (designated A, B or C) of 3 tubes each. Each tube contained the same artificial recombinant (unknown) protein in varying amounts and formats (see table below). Participants chose which of three sample sets - or any combination of sets - they would like to receive. Participants obtained the following information: (a) protein MW is ~52 kDa, (b) the sequence is NOT in a public database,(c) tubes 1 with lowest sample amount contains ~ 5 pmol protein in the selected format (d) potential presence of a co-purified E. coli protein at <20 kDa in Sample Set A is known, but of no interest to current study and(e) Sample Set A are soluble in 0.1% TFA, 0.1 % TFA/20 % acetonitrile or 25 mM AMBIC. Study participants were directed to a website to anonymously upload sequences and supporting data. The analysis of the results of the 2011 study focuses on the length and accuracy of the sequence calls depending on increasing amounts of protein. A total of 38 participants requested 74 sample sets. Study Results: Edman Sequencing Protein Sequencing Research Group (PSRG): Results of the PSRG 2011 Study: SensitivityAssessmentof Edman and Mass Spectrometric Terminal Sequencing of an Undisclosed Protein H.A. Remmer1, J.S.Smith2, W.Sandoval3, B.Xiang4, K.Mawuenyega5, D. Suckau6, V. Katta3, J.J. Walters7,P.Hunziker8 1University of Michigan, Ann Arbor, MI, United States, 2University of Texas Medical Branch, Galveston, TX, United States, 3Genentech, Inc., South San Francisco, CA, United States, 4Monsanto Company, St. Louis, MO, United States, 5Washington University School of Medicine, St. Louis, MO, United States, 6Bruker Daltonics, Bremen, Germany, 7Sigma-Aldrich, St. Louis, MO, United States, 8University of Zurich, Zurich, Switzerland STUDY METHODS: The PSRG prepared the 3 sample sets for distribution as follows: The study protein (95% purity by SEC) was dissolved in 50% acetonitrile/0.1% TFA, lyophylized and the protein content was determined by AAA. The sample was the aliquoted based on protein content to achieve the desired concentrations (5pmol, 15pmol and 45pmol respectively). Samples A were lyophylized, samples B and C were subjected to SDS-PAGE (B) and subsequent electroblotting (C). Upon test analyses for validation, presence of contaminating proteins were acknowledged and found to mimic a client sample in a core facility setting. The validation analysis by ISD was performed on an UltrafleXtreme MALDI-TOF/TOF instrument after samples were shipped and showed that much less protein was available for analysis than anticipated by the original protein quantification. Participants obtained instructions for dissolution of samples in set A. However, valid ISD was only obtained for nominal 100pmol of the sample. The participants were asked to use their code number to report their data in Survey Monkey (www.surveymonkey.com). TYPICAL PARTICIPANT METHODS Edman Degradation Most participants performed the analysis on a Procise 494HT sequencer using standard reagents and protocols. The majority of participants used the sample as provided. For sample set C, the pvdf membrane was directly loaded onto the instrument, for set A, the sample was dissolved in 0.1% TFA containing 20%-50% acetonitrile, and applied onto a prosorb filter. Initial yields and repetitive yields were reported (see table). Bottom-up MS Method: Sample sets A and B were used for this analysis; samples A were dissolved in ammonium bicarbonate and digested usually using Trypsin and 1-2 additional enzymes. The analysis was mostly performed on an LTQ or LTQ Orbitrap and the MS/MS data were subjected to database search using Thermo Proteome Discoverer, or manual de novo mascot searches were performed. Top Down MS Method: The majority of participants utilized an Ultraflex MALDI-TOF/TOF instrument and performed in-source decay (ISD) using the matrices 2,5-diaminonapthalene (DAN) or 2,5-dihydroxybenzioc acid (DHB) as matrix. Study Results: Bottom-Up Sequencing CONCLUSION Edman degradation was successfully employed in this study to obtain N-terminal sequence information of an unknown protein, not present in public databases, independent of the sample format. However, the most frequently selected sample format was the PVDF membrane followed by the lyophilized sample. A slight dependency between concentration and read-length was found but intra group variation was much higher. Bottom-up work applied to the study samples typically yielded sequences of another protein . However, the correct sequence was called as well.One participant also called the 70 C-terminal residues. In this study, top-down sequencing was attempted by MALDI-ISD from samples A without any success.Investigation of the sample by PSRG showed that the accessible protein amount in samples A (lyophilized) to the analysis was only ~5% of what was determined by AAA potentially due to poor solubility. Only much higher sample amounts of A than distributed allowed to retrieve de novo sequences and several bacterial heat shock proteins (15-16 kDa range) were identified in that sample after LC protein separation. Taken together, Edman sequencing demonstrated that the strict dependency on sample material in particular when applied to a membrane after SDS-PAGE, allowed to operate quite robust and reliably. All mass spectrometric methods, if not linked strictly to an intact protein MW, can easily identify “non target” sequences. Here the solubility and the homogeneity of the sample play a much greater role, in particular for the top-down approaches that have the highest requirement for sample amount and quality to be particularly recognized in future studies. REFERENCE: T. Kishimoto, J. Kondo, T. Takako-Igarashi and H. Tanaka. A novel method for analyzing protein terminals. Poster presented at the ASMS conference, Salt Lake City, 2010. Study Results: Top-Down Sequencing ACKNOWLEDGEMENTS Dr. Robert English (University of Texas Medical Branch) for accumulation & annonimization of data; Sigma-Aldrich for donation of the study sample; the Executive Board of the ABRF for support and scrutiny of the study proposal, Dr. Jack Simpson (National Cancer Institute, Frederick, MD) for functioning as liaison to the ABRF Executive Board, and participating labs for analyzing sample and returning data.