Download
1 / 18
180 likes | 620 Views
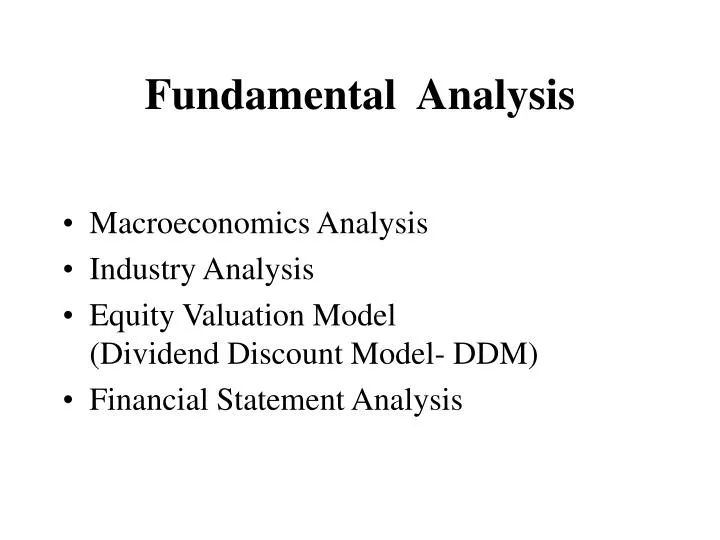
Fundamental Analysis. Macroeconomics Analysis Industry Analysis Equity Valuation Model (Dividend Discount Model- DDM) Financial Statement Analysis. Macroeconomics Analysis. Global Economy Analysis affects export, price competition and profits exchange rate: purchasing power and earnings

E N D
Fundamental Analysis • Macroeconomics Analysis • Industry Analysis • Equity Valuation Model(Dividend Discount Model- DDM) • Financial Statement Analysis
Macroeconomics Analysis • Global Economy Analysis • affects export, price competition and profits • exchange rate: purchasing power and earnings • Domestic Economy • The ability to forecast the macroeconomy can translate into great investment performance • outperform other analysts to earn extra profitsMany variables can affect economy
Gross Domestic Product (GDP): measures the economy’s total output of goods and services • Employment rate:measures the extent that the economy is operating at full capacity • Inflation measures the general level of prices increase Phillip’s curve • Interest Ratehigh interest rate reduces PV of cashflows, thus stock values • Budget Deficit large deficit means more borrowing, which implies higher interest rate. • Sentiment consumers and producers confidence
Business Cycles • business cycles: pattern of recession and recovery • peak: the end of expansion and start of recession • trough: the bottom of the recession • stock returns are decreasing when at peak and increasing at trough • cyclical industries: do well in expansionary periods but poorly in recession, e.g., durable goods such as automobile and wash machines • defensive industries: little sensitive to business cycles, such food
Industry Analysis • Select a good industry to invest. It is difficult for a firm to do well in a troubled industry • Standard Industry Classification (SIC) code • Value line Investment Survey - reports 1700 firms in 90 industries • Two factors that determine the sensitivity of a firm’s earnings to business conditions:business risk,financial risk
Business risk • Sales sensitivity to business conditionsome industries are robust (food) while others are not (movie) • operating leverage: the division between fixed and variable costs. • firms with greater amounts of variable cost relative to the fixed cost are subject less to business fluctuations, thus profits are more stable Financial Risk • the degree in using financial leverage (the amount of interest payment) • leverage firm is more sensitive to business cycles
Industry cycles Start-up Build-up Maturity Decline Start-up: increasing growth Build-up/consolidation: stabilized growth maturity: slower growth Decline: shrinking growth
Equity Valuation Model • Dividend Discount Model (DDM)V0= (D1+P1)/(1+k) = D1/(1+k) + D2/(1+k)2 ...+ Dn/(1+k)n • constant growth assumptionV0 = D1/(1+k) + D1(1+g)/(1+k)2 +D1(1+g)2/(1+k)3 + ... = D1/(k-g)or k = expected return = D1/P0 + g
Multistage Growth Model • Growth profile may not be constant such as: Expected Growth g1 g2 n Time V=D0(1+g1)/(1+k)+...+D0(1+g1)n/(1+k)n + D0(1+g1)n(1+g2)/(1+k)n+1+ ... and so on
Illustration of two-stage Growth Model • A stock pays $1 dividend now and its g1=30% for 6 yrs. Thereafter, its g2=6%, its k=15% • yr 1: $1(1+0.3) =1.13yr 2: 1(1+0.3)2=1.69yr 3: 1(1+0.3)3=2.20yr 4: 1(1+0.3)4 =2.86.yr 7: 1(1+0.3)6(1+6%)=5.12yr 8: 1(1+0.3)6(1+6%)2 =5.42 .
Market Value (equity) Market value is the present value of its future dividendsTime PV(Dt) Growth rate0 34.0 - 1 37.8 11.17% 2 41.78 10.52 3 45.85 9.74At time 1: FV(Dividends) = 34.00(1.15) - 1.3= 37.8 At time 2: FV(dividends) = 37.80(1.15) - 1.69=41.78Expected return at time 0 (15%) = Yr end dividend/current price + growth rate= 1.3/34 + 11.17%
P/E Ratio Behaviors • Price = No growth value/share P0 = E1/k + PVGOor • P0/E1= [1+ PVGO]/k E1/k P/E average Time
Pitfalls in P/E Analysis • Denomination of P/E ratio is the accounting earnings (arbitrary rules or historical cost will distort the earnings figures) • Earning should be based on economic earnings (i.e., net of economic deprecation) • Earnings are future figures vs P/E ratio (which uses past accounting earnings)
Earnings Forecast • Models for forecasting:Ei,t = gi + Ei,t-4 +ai(Ei,t-1-Ei,t-5)where g: growth factor a: adjustment factor E: Earnings • Time Series AnalysisARMA model Exponential smoothing • professional institution forecast • Performance Evaluation MSE or others
Financial Statement Analysis • Preparation of Source/Use Fund Statement • Ratio Analysis • Performance Analysis • Du Pont Analysis
Use/source of Fund Statement • Sources UsesC. Paper $ 5.8 Cash $ 0.4A/P 17.8 A/R 16.2Div/P 1.4 Inv 34.8S/T debt 4.6 Prep. Ex 0.4S/T Lease 3.8 Lease 82.8L/T Debt 20.6 Others 3.6L/T Lease 25.0 Tax 1.0C/S 3.2P/I Cap 0.6NI 54.4 Div. 46.6Depreciation 48.6Total 185.8 185.8
Analysis of Use/Source • Sales growth=3.5% • Uses- major componentA/R =8.72%; Inventory = 18.73%; Lease = 44.6%Dividend = 25.1% • SourcesA/P = 9.5%; L/T debt = 11.1%; L/T lease = 13.4%Operation profits = 55.4%(NI+depreciation) • Why issue shares? • S/T-/LT capital increases so much?
Ratio Analysis • Assets Sales Profit • Liquidity Ratio • Risk Ratio • Du Pond Analysis ROE=Net Income(NI)/Equity (E)= NI Pretax Prof EBIT Sale TA P.Prof EBIT Sales TA E TB IB GPM TAT EMPretax profit =EBIT - InterestTB = Tax burdenIB = interest burden