Download
1 / 18
190 likes | 1.03k Views
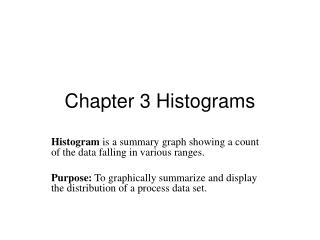
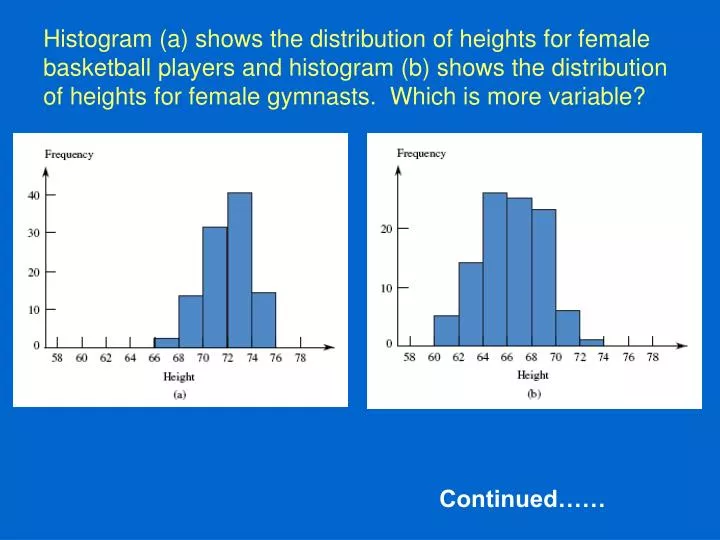
Histogram (a) shows the distribution of heights for female basketball players and histogram (b) shows the distribution of heights for female gymnasts. Which is more variable? Continued……

E N D
Histogram (a) shows the distribution of heights for female basketball players and histogram (b) shows the distribution of heights for female gymnasts. Which is more variable? Continued……
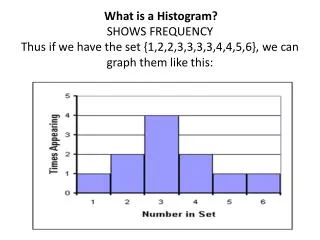
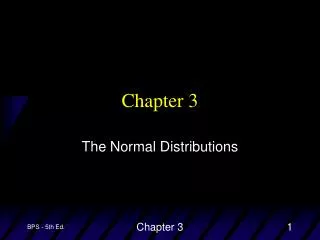
Histogram (a) shows the distribution of heights for female basketball players and histogram (b) shows the distribution of heights for female gymnasts. Which is more variable? Histogram (a) shows the distribution of heights for female basketball players and histogram (b) shows the distribution of heights for female gymnasts. Which is more variable? {image} {image} • Heights of female basketball players • Heights of female gymnasts
Histogram (a) shows the distribution of heights for female basketball players and histogram (b) shows the distribution of heights for female gymnasts. A height of 68 inches is more typical of . Continued……
Histogram (a) shows the distribution of heights for female basketball players and histogram (b) shows the distribution of heights for female gymnasts. A height of 68 inches is more typical of . Histogram (a) shows the distribution of heights for female basketball players and histogram (b) shows the distribution of heights for female gymnasts. A height of 68 inches is more typical of ________? {image} {image} • female basketball players • female gymnasts
In order to understand hibernating black bears, a researcher measured the body temperature of ten black bears during hibernation (the best time to measure the body temperature of a bear!). The ten black bears studied are ________. • a sample • the population
A researcher used data from a sample of ten black bears to estimate the average body temperature of hibernating black bears in general. This is an example of the use of ________. • descriptive statistics • inferential statistics
Which of the following attributes is categorical? • The number of pizza boxes a worker can assemble in a 10 minute period • The time it takes a worker to assemble a pizza box • The number of pizzas ordered in 1 hour • Whether the next pizza ordered is for pick-up or delivery
Which of the following attributes is continuous numerical? • The number of pizza boxes a worker can assemble in a 10 minute period • The time it takes a worker to assemble a pizza box • The number of pizzas ordered in 1 hour • Whether the next pizza ordered is for pick-up or delivery
Which of the following is not a categorical variable? • City of residence • Telephone area code • Number of calls in response to a newspaper classified ad • Preferred brand of cola
Possible values for a discrete numerical variable must be positive integers. • True • False
A numerical variable that can take on only positive integer values is a discrete numerical variable. • True • False
Zip code ________. • is a discrete numerical variable • is not a discrete numerical variable because it can not take on a negative value • is not a discrete numerical variable because zip code is just a code for a geographical region
In a survey of attitudes toward science, college students were asked whether or not they had been encouraged to study science by a high school teacher or counselor. The responses were coded 0 for no and 1 for yes. The resulting data set is ________. • continuous numerical • discrete numerical • categorical
Ten bags of microwave popcorn were heated on high for 3 minutes and the percent of unpopped kernels was recorded. For these ten bags, the percent unpopped ranged from a low of 8% to a high of 22%. Which of the following dot plots could be the dot plot of this data? • . • . • . Continued……
1. 2. 3. Ten bags of microwave popcorn were heated on high for 3 minutes and the percent of unpopped kernels was recorded. For these ten bags, the percent unpopped ranged from a low of 8% to a high of 22%. Which of the following dot plots could be the dot plot of this data? • {image} • {image} • {image}
Fifty college students were asked what type of movie they had seen most recently. The responses are summarized in the frequency distribution shown. Which of the two graphs below is a correct bar chart for this data?Type of Movie Frequency Comedy 23 Drama 9 Action 7 Western 4 Animated 4 Other 3 2. Continued……
1. 2. Fifty college students were asked what type of movie they had seen most recently. The responses are summarized in the frequency distribution shown. Which of the two graphs below is a correct bar chart for this data? Type of Movie Frequency Comedy 23Drama 9Action 7Western 4Animated 4Other 3 Fifty college students were asked what type of movie they had seen most recently. The responses are summarized in the frequency distribution shown. Which of the two graphs below is a correct bar chart for this data? {image} • {image} • {image}
Fifty college students were asked what type of movie they had seen most recently. The responses are summarized in the frequency distribution shown. Type of Movie Frequency Comedy 23Drama 9Action 7Western 4Animated 4Other 3What is the relative frequency for the comedy category? Fifty college students were asked what type of movie they had seen most recently. The responses are summarized in the frequency distribution shown. {image} What is the relative frequency for the comedy category? • 23 • .23 • .46 • 46