Download
1 / 7
0 likes | 16 Views
Visualpath providing Data Analytics training in Hyderabad with complete real time based. Training by Real Time Experts with free Data Analytics Tutorials, Interview Questions and Recorded Videos will be provided. Enroll Now for FREE DEMO..! . Call on 91-9989971070. <br>Telegram: https://t.me/ bEu9LVFFlh5iOTA9<br>WhatsApp : https://www.whatsapp.com/catalog/919989971070/<br>Visit : https://www.visualpath.in/data-analytics-online-training.html<br><br>

E N D
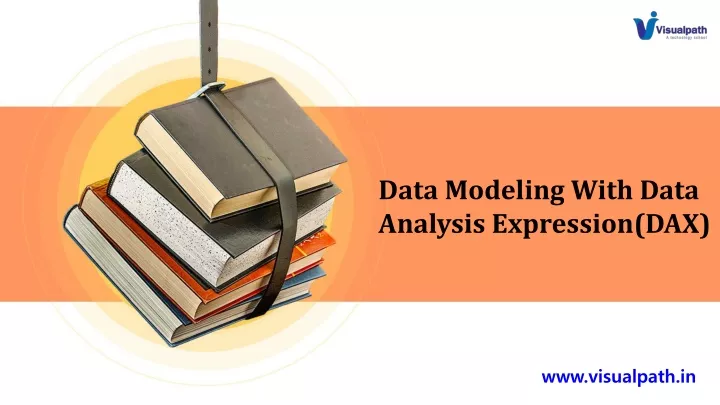
Data Modeling With Data Analysis Expression(DAX) www.visualpath.in
Data Analytics, Data Modeling, and DAX (Data Analysis Expressions) are key concepts in the field of business intelligence and data management, often associated with tools like Microsoft Power BI and Excel. Let's explore each of these concepts: 1. Data Analytics: - Definition: Data analytics involves the process of inspecting, cleansing, transforming, and modeling data to discover useful information, draw conclusions, and support decision-making. - Process: - Data Collection: Gathering relevant data from various sources. - Data Cleaning: Ensuring data quality by handling missing values, outliers, etc. - Data Transformation: Converting raw data into a format suitable for analysis. www.visualpath.in
- Data Modeling: Creating models to represent the relationships between different data entities. - Data Analysis: Applying statistical and mathematical techniques to uncover patterns and insights. - Visualization: Presenting findings through charts, graphs, and dashboards. 2. Data Modeling: - Definition: Data modeling involves creating a visual representation of the structure and relationships within a dataset. - It helps in understanding and organizing data for effective analysis. - Types of Data Models: - Conceptual Model: Represents high-level relationships between different entities - Logical Model: Defines the data structure without concern for the specific database management system. www.visualpath.in
- Physical Model: Specifies how data will be stored, including tables, columns, and relationships. - Tools: ERD (Entity-Relationship Diagrams), UML (Unified Modeling Language), and tools like Microsoft Visio are commonly used for data modeling. 3. DAX (Data Analysis Expressions): - Definition: DAX is a formula language used in Power BI, Excel, and other Microsoft tools for data manipulation and analysis. - It is designed for creating custom formulas and expressions in Power BI and Excel to perform calculations on data. - Common DAX Functions: - Mathematical Functions: SUM, AVERAGE, MIN, MAX, etc. - Statistical Functions: VAR, STDEV, etc. - Date and Time Functions: TODAY, NOW, YEAR, MONTH, etc. www.visualpath.in
- Filter Functions: CALCULATE, ALL, FILTER, etc. - Text Functions: CONCATENATE, LEFT, RIGHT, etc. - Use Cases: DAX is used to create calculated columns, measures, and calculated tables in Power BI, enabling users to derive new information from existing data. In summary, data analytics involves the end-to-end process of deriving insights from data. Data modeling helps in structuring and understanding the data. DAX is a powerful language for creating custom calculations and expressions. Especially in the context of tools like Power BI and Excel. Combining these concepts allows for effective analysis and visualization of data in a business context. www.visualpath.in
CONTACT For More Information About Data Analytics Online Training Address:- Flat no: 205, 2nd Floor, Nilagiri Block, Aditya Enclave, Ameerpet, Hyderabad-16 Ph No : +91-9989971070 Visit : www.visualpath.in E-Mail : online@visualpath.in www.visualpath.in
Thank You www.visualpath.in