Download
1 / 4
40 likes | 99 Views
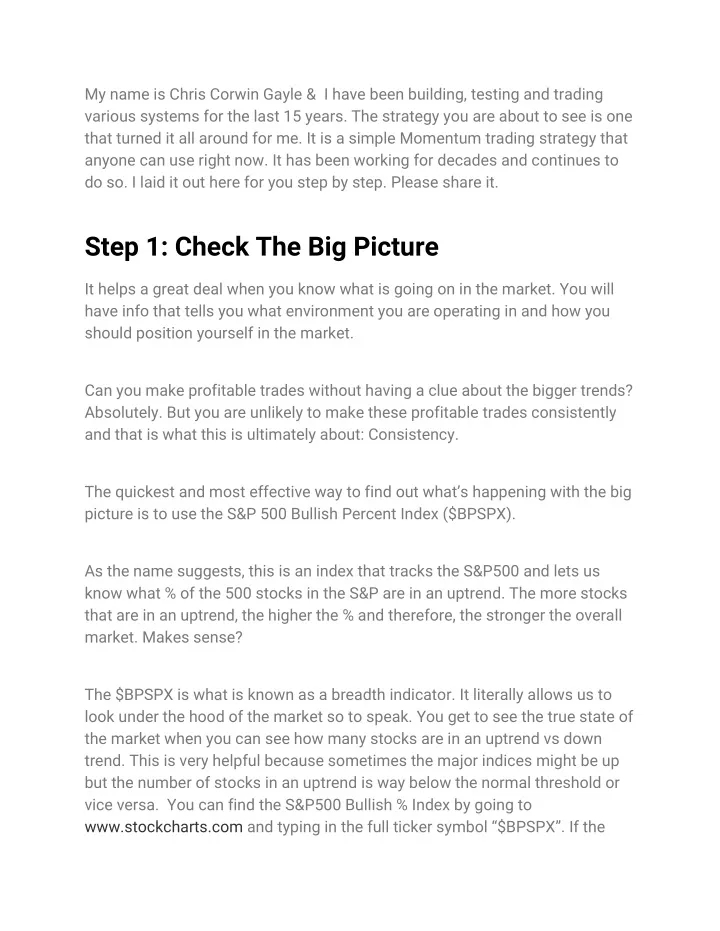
My name is Chris Corwin Gayle & I have been building, testing and trading various systems for the last 15 years. The strategy you are about to see is one that turned it all around for me. It is a simple Momentum trading strategy that anyone can use right now. It has been working for decades and continues to do so. I laid it out here for you step by step. Please share it.

E N D
My name is Chris Corwin Gayle & I have been building, testing and trading various systems for the last 15 years. The strategy you are about to see is one that turned it all around for me. It is a simple Momentum trading strategy that anyone can use right now. It has been working for decades and continues to do so. I laid it out here for you step by step. Please share it. Step 1: Check The Big Picture It helps a great deal when you know what is going on in the market. You will have info that tells you what environment you are operating in and how you should position yourself in the market. Can you make profitable trades without having a clue about the bigger trends? Absolutely. But you are unlikely to make these profitable trades consistently and that is what this is ultimately about: Consistency. The quickest and most effective way to find out what’s happening with the big picture is to use the S&P 500 Bullish Percent Index ($BPSPX). As the name suggests, this is an index that tracks the S&P500 and lets us know what % of the 500 stocks in the S&P are in an uptrend. The more stocks that are in an uptrend, the higher the % and therefore, the stronger the overall market. Makes sense? The $BPSPX is what is known as a breadth indicator. It literally allows us to look under the hood of the market so to speak. You get to see the true state of the market when you can see how many stocks are in an uptrend vs down trend. This is very helpful because sometimes the major indices might be up but the number of stocks in an uptrend is way below the normal threshold or vice versa. You can find the S&P500 Bullish % Index by going to www.stockcharts.com and typing in the full ticker symbol “$BPSPX”. If the
index is above 55% then it means the Bulls are in control and the market is in an overall uptrend. On the other hand, if the index is below 55% then the market is in an overall downtrend and the bears are in control. You will rarely find yourself guessing about the broad market trends when using this tool because it doesn’t send mixed signals. Its either above 55% or below 55%. No noise or opinions ( like the CNBC pundits) . Just a strong clear signal. So when I pull up the $BPSPX I am looking to answer one simple question: Who is in control? If the bulls are in control, then I am looking for stocks to buy/go long. If the bears are in control, then I am looking for stocks to go short. By doing this, you will never find yourself trading against the overall trend of the market. You will always have the wind at your back and this makes for easier, more profitable trades.
You do not need a subscription to look at this index on StockCharts.com but when it loads it will have some indicators on it. Nothing major, just a few Moving Averages, The MACD and the RSI. Just scroll to the bottom of the page and remove these indicators by clicking the dropdown box and selecting “none” and then click “Update”. You want to remove all the indicators so you can clearly see the price action. That is all that you need because it is all that matters. And remember: Above 55% Bullish & Below 55% Bearish.
Step 2: Find Your Trades So now that you know what’s going on and you can clearly see who is in control, you can make up your mind what direction you want to trade in. And remember, it is always best to trade with the wind at your back. So if the bulls are in control, you want to go long. Simple.