Download
1 / 95
960 likes | 1.19k Views
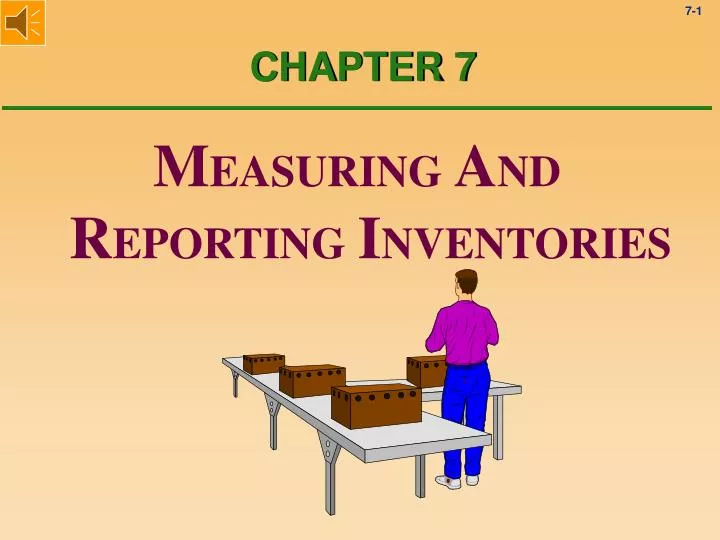
M EASURING A ND R EPORTING I NVENTORIES. CHAPTER 7. . Inventory. “Inventory is often the largest and most important asset owned by a merchandising company.” What is the biggest expense on the income statement? Cost of Goods Sold

E N D
MEASURINGANDREPORTINGINVENTORIES CHAPTER 7 .
Inventory “Inventory is often the largest and most important asset owned by a merchandising company.” What is the biggest expense on the income statement? Cost of Goods Sold What are the two major factors in determining Cost of Goods Sold? (Beg. Inventory + Purchases - End. Inventory)
Inventory • Inventory is where the action is! • It’s a real can of worms.
Balance Sheet Amount The inventory dollar amount on the balance sheet is the product of what two factors? (i.e., What? x What?) Balance Sheet Amount = Quantity x Cost “War stories” aboutinventory observations
251 Inventory Costs Include • Invoice price • Insurance while in transit • Transportation • Handling costs to get the inventory ready for sale e.g., washing cars (i.e., all costs to get the inventory into a position and condition for resale.)
Impact of Inventory Errorson Financial Statements • Errors in inventory may cause misstatements in the following areas: • Income Statement • COGS, Gross Margin, Net Income • Balance Sheet • Inventory, Retained Earnings
12-31 12-31 19A 19B Error Income Statement: Impact of Error? Year Ended 12-31-19A Year Ended 12-31-19B Balance Sheet: 12-31-19A 12-31-19B Impact of Inventory Errorson Financial Statements Assume that the inventory at the end of 19A is misstated. • What is the impact of the error on the Income Statements and Balance Sheets for 19A and 19B? Wrong End Inv, COGS, GM, Net Income Wrong Beg Inv, COGS, GM, Net Income Wrong Inventory and Retained Earnings Nothing wrong! The error "washes out" (i.e., counterbalances)
Impact of Inventory Errorson Financial Statements O.K. O.K. 5k over 5k under 5k over O.K. 5k over O.K. 5k over 5k over
Impact of Inventory Errorson Financial Statements O.K. 5k over O.K. 5k over O.K. 5k over 5k under O.K. 5k under 5k over 5k under O.K.!!!
Retained Earnings 120,000 Balance 1-1-98 55,000 Net Income - 1998 86,500 Net Income - 1999261,500 Balance 12-31-99 As recordedAs recorded Impact of Inventory Errorson Financial Statements Additional proof that Retained Earnings at the end of Year 2 are O.K. 5,000 over5,000 underO.K.!!! Proof that sometimes, in fact, two wrongs do make a right!
Impact of Inventory Errorson Financial Statements Why bother? Here is a summary of the the material we just finished. Effects of Errors in Inventory Ending Inventory Beginning Inventory Understated Overstated Understated Overstated Cost of Goods Sold Overstated Understated Understated Overstated Net Income Understated Overstated Overstated Understated 250
Overstated by 5K Impact of Inventory Errorson Financial Statements There is a much simpler way of getting the effect of an error on net income. • I call it the “sneaky way” because it uses the balance sheet equation. • As before in ILL. 7.1, if inventory at 12-31-98 is overstated by $5,000, determine the effect on 1998 net income as follows: 12-31-98 A = L + S/E Overstated by 5K
Perpetual Method vs. Periodic Method Methods of DeterminingInventory Cost Periodic method was discussed in Chapter 6
Perpetual Inventory Procedure The inventory account is continuouslyupdated for . . . • Inventory purchases • Purchase returns • Inventory sales • Sales returns
Comparing Journal Entries For comparison, let’s make the journal entries for each of the following transactions using both the periodic and perpetual methods. Keep in mind that sales under the perpetual method require two journal entries.
Comparing Journal Entries On September 5, Worley Co. purchased 100 units of inventory for $30 per unit. GENERAL JOURNAL Page 1 Date Description PR Debit Credit PERIODIC PERPETUAL
Comparing Journal Entries On September 5, Worley Co. purchased 100 units of inventory for $30 per unit. GENERAL JOURNAL Page 1 Date Description PR Debit Credit PERIODIC 9/5 Purchases 3,000 Accounts Payable 3,000 PERPETUAL 9/5 Merchandise Inventory 3,000 Accounts Payable 3,000
Comparing Journal Entries On September 7, Worley Co. sold 10 of the previously purchased units for $50 each. GENERAL JOURNAL Page 1 Date Description PR Debit Credit PERIODIC PERPETUAL
Comparing Journal Entries On September 7, Worley Co. sold 10 of the previously purchased units for $50 each. GENERAL JOURNAL Page 1 Date Description PR Debit Credit The Cost of Goods Sold account is an expenseaccount and is closed to Income Summary at the end of the period just like all other expense accounts. PERIODIC 9/7 Accounts Receivable 500 Sales 500 PERPETUAL 9/7 Accounts Receivable 500 AT SALES PRICE Sales 500 Cost of Goods Sold 300 AT COST Merchandise Inventory 300
Comparing Journal Entries On Sept. 8, Worley Co. returned 2 of the previously purchased units as defective. GENERAL JOURNAL Page 1 Date Description PR Debit Credit Periodic Perpetual
Comparing Journal Entries On Sept. 8, Worley Co. returned 2 of the previously purchased units as defective. GENERAL JOURNAL Page 1 Date Description PR Debit Credit Periodic 9/8 Accounts Payable 60 Purchase Returns and Allowances 60 ( 2 @ $30 per units = $60) Perpetual 9/8 Accounts Payable 60 Merchandise Inventory 60
Inventory Cost Flow Methods • Specific identification • First-in, first-out (FIFO) • Last-in, first-out (LIFO) • Weighted average
Inventory Cost Flow Methods Reminder from the “Saturday Night Page” Calculation of Cost of Goods Sold Beginning Inventory + Purchases, etc Cost of Goods Available for Sale - Ending Inventory Cost of Goods Sold (The top part is not relevant to this discussion.) So, GAS - EI = CGS Or, GAS = EI + CGS
Inventory Cost Flow Methods Cost of Goods Available for Sale Ending Inventory Cost of Goods Sold
Specific Identification • Attaches actual cost to an identifiable unit of product • Used for relatively large inventory items • Frequently identified by serial number
First-In, First-Out COST OF GOODS AVAILABLE FOR SALE
Oldest Costs Newest Costs First-In, First-Out Cost of Goods Sold Ending Inventory
First-In, First-OutPeriodic Inventory Procedure The following schedule shows the mouse pad inventory for Computers, Inc. for September. The physical inventory count shows 800mouse pads in ending inventory. Use the FIFO procedure to determine: (1) Ending inventory (2) Cost of goods sold
First-In, First-OutPeriodic Inventory Procedure Computer, Inc. Mouse Pad Inventory Date Units Unit Cost Total BI 1,000 $ 5.25 $ 5,250.00 9/3 Pur. 100 5.30 530.00 9/15 Pur. 150 5.60 840.00 9/21 Pur. 200 5.80 1,160.00 9/29 Pur. 100 5.90 590.00 Goods available for sale 1,550 $ 8,370.00 Ending inventory 800 Cost of goods sold 750
First-In, First-OutPeriodic Inventory Procedure Remember: FIFO ending inventory is calculated using the cost of the newest purchases. Start with 9/29 and then add other purchases until you reach the number of units in ending inventory. Computer, Inc. Mouse Pad Inventory Date Units Unit Cost Total BI 1,000 $ 5.25 $ 5,250.00 9/3 100 5.30 530.00 9/15 150 5.60 840.00 9/21 Pur. 200 5.80 1,160.00 9/29 Pur. 100 5.90 590.00 Goods available for sale 1,550 $ 8,370.00 Ending inventory 800 Cost of goods sold 750
Computer, Inc. Mouse Pad Inventory Date Beg. Inv. Purchases End Inv. Goods Sold First-In, First-OutPeriodic Inventory Procedure Cost of 9/29 100@$5.90 100@$5.90 Units 100
Computer, Inc. Mouse Pad Inventory Date Beg. Inv. Purchases End Inv. Goods Sold First-In, First-OutPeriodic Inventory Procedure Cost of 9/21 200@$5.80 200@$5.80 9/29 100@$5.90 100@$5.90 Units 300
Computer, Inc. Mouse Pad Inventory Date Beg. Inv. Purchases End Inv. Goods Sold First-In, First-OutPeriodic Inventory Procedure Cost of 9/15 150@$5.60 150@$5.60 9/21 200@$5.80 200@$5.80 9/29 100@$5.90 100@$5.90 Units 450
Computer, Inc. Mouse Pad Inventory Date Beg. Inv. Purchases End Inv. Goods Sold First-In, First-OutPeriodic Inventory Procedure Cost of 9/3 100@$5.30 100@$5.30 9/15 150@$5.60 150@$5.60 9/21 200@$5.80 200@$5.80 9/29 100@$5.90 100@$5.90 Units 550
Computer, Inc. Mouse Pad Inventory Date Beg. Inv. Purchases End Inv. Goods Sold First-In, First-OutPeriodic Inventory Procedure Cost of BI 1000@$5.25 250@$5.25 9/3 100@$5.30 100@$5.30 9/15 150@$5.60 150@$5.60 9/21 200@$5.80 200@$5.80 9/29 100@$5.90 100@$5.90 Units 800
Computer, Inc. Mouse Pad Inventory Date Beg. Inv. Purchases End Inv. Goods Sold First-In, First-OutPeriodic Inventory Procedure Cost of BI 1000@$5.25 750@$5.25 250@$5.25 9/3 100@$5.30 100@$5.30 9/15 150@$5.60 150@$5.60 9/21 200@$5.80 200@$5.80 9/29 100@$5.90 100@$5.90 Units 800 750 Costs $ 4,432.50 $ 3,937.50 Cost of Goods Available for Sale $8,370.00
Computer, Inc. Mouse Pad Inventory Date Beg. Inv. Purchases End Inv. Goods Sold First-In, First-OutPeriodic Inventory Procedure Cost of BI 1000@$5.25 750@$5.25 250@$5.25 9/3 100@$5.30 100@$5.30 9/15 150@$5.60 150@$5.60 9/21 200@$5.80 200@$5.80 9/29 100@$5.90 100@$5.90 Units 800 750 Costs $ 4,432.50 $ 3,937.50 Cost of Goods Available for Sale $8,370.00
Oldest Costs Newest Costs Last-In, First-Out Ending Inventory Cost of Goods Sold
Last-In, First-OutPeriodic Inventory Procedure The following schedule shows the mouse pad inventory for Computers, Inc. for September. The physical inventory count shows 800 mouse pads in ending inventory. Use the LIFO periodic procedure to determine: (1) Ending inventory (2) Cost of goods sold
Last-In, First-OutPeriodic Inventory Procedure Computer, Inc. Mouse Pad Inventory Date Units Unit Cost Total BI 1,000 $ 5.25 $ 5,250.00 9/3 Pur. 100 5.30 530.00 9/15 Pur. 150 5.60 840.00 9/21 Pur. 200 5.80 1,160.00 9/29 Pur. 100 5.90 590.00 Goods available for sale 1,550 $ 8,370.00 Ending inventory 800 Cost of goods sold 750
Last-In, First-OutPeriodic Inventory Procedure Computer, Inc. Mouse Pad Inventory Date Units Unit Cost Total BI 1,000 $ 5.25 $ 5,250.00 9/3 Pur. 100 5.30 530.00 9/15 Pur. 150 5.60 840.00 9/21 200 5.80 1,160.00 Remember: LIFO ending inventory is calculated using the cost of the oldest purchases. Start with beginning inventory and then add other purchases until you reach the number of units in ending inventory. 9/29 100 5.90 590.00 Goods available for sale 1,550 $ 8,370.00 Ending inventory 800 Cost of goods sold 750
Last-In, First-OutPeriodic Inventory Procedure Computer, Inc. Mouse Pad Inventory Cost of Date Beg. Inv. Purchases End Inv. Goods Sold BI 1000@$5.25 800@$5.25 Units 800
Last-In, First-OutPeriodic Inventory Procedure Computer, Inc. Mouse Pad Inventory Cost of Date Beg. Inv. Purchases End Inv. Goods Sold BI 1000@$5.25 800@$5.25 200@$5.25 Units 800 200
Last-In, First-OutPeriodic Inventory Procedure Computer, Inc. Mouse Pad Inventory Cost of Date Beg. Inv. Purchases End Inv. Goods Sold BI 1000@$5.25 800@$5.25 200@$5.25 9/3 100@$5.30 100@$5.30 800 300
Last-In, First-OutPeriodic Inventory Procedure Computer, Inc. Mouse Pad Inventory Cost of Date Beg. Inv. Purchases End Inv. Goods Sold BI 1000@$5.25 800@$5.25 200@$5.25 9/3 100@$5.30 100@$5.30 9/15 150@$5.60 150@$5.60 9/21 200@$5.80 200@$5.80 9/29 100@$5.90 100@$5.90 Units 800 750
Last-In, First-OutPeriodic Inventory Procedure Computer, Inc. Mouse Pad Inventory Cost of Date Beg. Inv. Purchases End Inv. Goods Sold BI 1000@$5.25 800@$5.25 200@$5.25 9/3 100@$5.30 100@$5.30 9/15 150@$5.60 150@$5.60 9/21 200@$5.80 200@$5.80 9/29 100@$5.90 100@$5.90 Units 800 750 Costs $ 4,200.00 $ 4,170.00 Cost of goods available for sale $8,370.00