Download
1 / 15
150 likes | 178 Views
tUTI Nifty Next 50 Index Fund invests in equity instruments comprised in Nifty Next 50 index. Click here to know more UTI nifty next 50 share price and fund growth.<br>

E N D
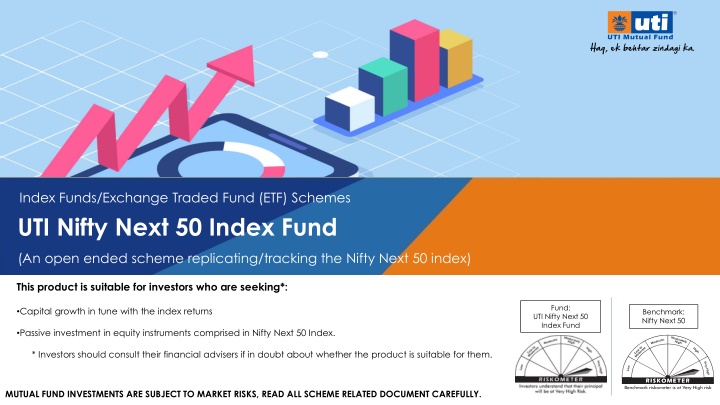
Index Funds/Exchange Traded Fund (ETF) Schemes UTI Nifty Next 50 Index Fund (An open ended scheme replicating/tracking the Nifty Next 50 index) This product is suitable for investors who are seeking*: Fund: •Capital growth in tune with the index returns Benchmark: Nifty Next 50 UTI Nifty Next 50 Index Fund •Passive investment in equity instruments comprised in Nifty Next 50 Index. * Investors should consult their financial advisers if in doubt about whether the product is suitable for them. MUTUAL FUND INVESTMENTS ARE SUBJECT TO MARKET RISKS, READ ALL SCHEME RELATED DOCUMENT CAREFULLY.
Growth of Equity Exchange Traded Funds and Index Funds in India ETFs and Index Funds AUM as % of Total Industry AUM* ETF and Index Fund AUM Growth 13% 4,97,830 10% AUM in Rs. Crs. 7% 3,08,661 % share 6% 4% 1,62,377 1,44,765 3% 81,851 2% 1% 52,556 22,608 14,093 Mar-15 Mar-16 Mar-17 Mar-18 Mar-19 Mar-20 Mar-21 Mar-22 Mar-15 Mar-16 Mar-17 Mar-18 Mar-19 Mar-20 Mar-21 Mar-22 Period Period Major Growth Enablers Retirement Funds are mandated to invest at least 5% of annual accretion in Equities. Many of them have opted Equity ETFs/Index Funds for equity investment. • Categorization and Rationalization of Mutual Fund Schemes by SEBI$ • Benchmarking of funds moved from Price Return Index (PRI) to Total Return Index (TRI). • Challenges in generating alpha due to improving efficiency of equity market and reducing information asymmetry. • * Month End Asset Under Management (AUM). Source: MFI Explorer. $ with reference to circular number SEBI/HO/IMD/DF3/CIR/P/2017/114 SEBI - Securities and Exchange Board of India. TRI refers to index values which also account for dividends, whereas in case of Price Return Index (PRI), dividends distributed by companies forming part of an index are not considered. 2
What is an Equity Index? Rule Based Representation Indexing Investing in a aligned to particular index. I.e. equity portfolio will hold same stocks and in same proportion as represented by an Index. portfolio which is An Index is a rule based portfolio where, stocks/companies selected based on pre-defined rules without any biases Indices characteristics segment, capitalization, factors etc. represents certain market market themes, are of like sectors, a individual’s 3
Why Indexing? Easy to Understand Low Cost Low Risk It reduces the process of selection an stock/fund. Normally, index funds and ETFs available cost than managed funds. Helps in reducing un- systematic rewards for systematic risk. vis-à-vis individual are risk and at lower actively taking Market is efficient No Biases Zero Sum Game Movement in are based information indices collective interpretation by the various participants prices new and the Elimination individual’s biases & subjective while stocks/funds of Positive alpha* of one market has to come negative another participant on participant opinion picking from reflects alpha of market market * Alpha is difference between returns generated by a scheme and its benchmark. When a scheme generate more returns as compared to its benchmark is called positive alpha. When scheme generate less returns as compared to its benchmark, is called negative alpha. 4
Why Indexing? S&P Indices versus Active Fund (SPIVA) India Scorecard SPIVA India scorecard compares the performance of actively managed Indian mutual funds with their respective benchmark indices over 1, 3, 5, and 10 year period. • The comparison is done in a scientific way considering survivorship bias correction, style consistency, apple-to-apple comparison, asset weighted returns etc. • This semi-annual report is called as SPIVA scorecard. • Extract from the December 2021 Report: • Source: https://www.asiaindex.co.in/documents/spiva/spiva-india-year-end-2021.pdf ‘SPIVA report’ is published twice in a year i.e. for the period ending June and December of each year. The extract from latest available report is mentioned above. 5
Mutual Fund Products for Index Investment Exchange Traded Funds (ETFs) and Index Funds, both can be used for Investing in an Index under Mutual Fund route. • Both are very similar from fund management perspective. • Major Differences: • Features ETFs Index Funds Net Asset Value (NAV) Real Time End of the day Authorised Participants (APs) on stock exchange + Fund itself Liquidity Provider@ Only by Fund Portfolio Disclosure Daily Monthly Possible if investor has required inventory of units Intraday Trading Not possible Transaction costs are spread across the fund Cost effectiveness Each investor bears their own transaction cost Holding format Compulsory in Demat form Physical + Demat Controlled by investor as investor can suggest the price/NAV at which they want to transact Investment decision Not applicable @ - In case of ETFs the Scheme offers units for subscription / redemption directly with the Mutual Fund in multiple of creation unit size to Authorized Participants / Large Investors only. Investor can buy/sell ETF units in cash segment on secondary market of exchanges where it is listed in multiple of 1 unit. AMC may appoint APs for providing liquidity on exchanges. Please read scheme related documents for “creation unit size” 6
How Exchange Traded Fund works? ETFs are traded on exchange just like a normal stock Money Money Various investors, buying & selling ETF units on stock exchanges, creates natural liquidity. Secondary Market ETFs ETFs Stock Exchanges Buyers Sellers Generally, all trading and settlement rules applicable to a stock, are also applicable to ETFs. AMCs appoint Authorized Participants (APs) to provide additional liquidity. ETFs Money Money ETFs When there is high demand of units on exchanges, APs create units from AMCs and sell these units on exchanges. When there is high supply of units on exchanges, APs buy units on exchanges and redeem these units with AMCs. *APs / LIs Primary Market ETFs Money Money ETFs Fund House * AP – Authorized Participant. LIs – Large Investors. Fund House – Asset Management Company 7
How to Transact – ETFs v/s Index Funds Stock Exchanges ETF Units ETF units can be held only in dematerialized (demat) form. The holding is reflected in demat statement available participants where maintained Investor can get in touch with their stock broker or sub-broker to buy/sell ETFs through their broking account, similar to transacting in a stock. with account demat demat is Investor can get in touch with AMC or IFA/RIA/Distributor etc., to buy/sell Index Fund similar to transacting in traditional open- ended mutual fund scheme Index Fund units can be held in digital or dematerialized form. holding, investor can account from AMC Transfer Agent. In case get its of digital statement Registrar of or and Index Fund Fund House Additionally ETFs can be bought/sold through Asset Management Companies (AMCs) in multiple of creation unit size. 8
About ‘Nifty Next 50’ Index@ Parameter Details Broad Selection Criteria* Next 50 companies after Nifty 50 from the Nifty 100 Index Number of constituents 50 Market Capitalization and Exposure$ Top 5 Stocks# Weights in % 39,86,535 ADANI ENTERPRISES LTD. 5% M-Cap in Rs. Crores VEDANTA LTD 4% Market Exposure 15% ADANI GREEN ENERGY LTD 4% Stocks ADANI TRANSMISSION LTD. 3% SRF LTD. 3% 2,21,584 62,196 34,273 Others 81% Total M-Cap of Index Median M-Cap M-Cap of Top Company M-Cap of Bottom Company Data as on March 31, 2022. @Nifty Next 50 Index is an index product of NSE Indices Limited (a subsidiary of National Stock Exchange of India (NSE) Limited). Source: www.niftyindices.com, Bloomberg. * Subject to other selection criteria defined under index construction methodology. $ Data based on Total Market Capitalization of companies. % Market Exposure = Total Market Cap of Index / Market cap of all listed companies in NSE. # The Stocks referred in this literature are not an endorsement by the Mutual Fund and AMC of their soundness or a recommendation to buy or sell these stocks at any point of time. The name of companies are only for reference purpose. 9
Nifty Next 50 Index Comparison – Broad Sector Exposure Exposure in % Nifty 50 35% 10% 4% 0% 2% 49% Index Nifty Next 50 20% 16% 12% 9% 7% 36% Nifty MidCap 150 16% 9% 3% 4% 4% 63% FINANCIAL SERVICES CONSUMER GOODS METALS CONSUMER SERVICES POWER OTHERs Data as on March 31, 2022. Source : NSE, Bloomberg. # The sectors referred in this literature are not an endorsement by the Mutual Fund and AMC of their soundness or a recommendation to buy or sell at any point of time. The sectors are only for reference purpose. 10
Why Invest in Nifty Next 50? Nifty Next 50, well diversified large Cap index, has the potential to give Mid Cap like returns with relatively better drawdown protection. Large Cap$ Well Diversified@ Return behavior@*+~ Drawdown*+!~ Nifty exposure in Large Cap, thus can be categorized under ‘Large Cap Fund’ Next 50 index has 81% It has less exposure to financial services. Within financial services also, it is diversified across banks, NBFCs^, insurance management companies Historically, Nifty Next 50 Index has shown return behavior similar to Nifty Mid Cap 150 Index. Historically Nifty Next 50 has shown better downside protection over Nifty Mid Cap 150 Index and asset 2005 2006 2007 2008 2009 2010 2011 2012 2013 2014 2015 2016 2017 2018 2019 2020 2021 1,60,000 0% 1,40,000 Growth of Rs. 10,000 Nifty 500 77% -10% 1,20,000 Nifty 500 29% 1,00,000 -20% 80,000 -30% Nifty 50 100% 60,000 Nifty 50 35% Index -40% 40,000 Index 20,000 -50% Nifty Next 50 81% Nifty Next 50 20% 0 -60% 2005 2007 2009 2011 2013 2015 2017 2019 2021 -70% Period Nifty MidCap 150 13% Nifty MidCap 150 16% -80% Exposure to Large Caps in % Exposure to Financial Sector in % Nifty Midcap 150 TRI Nifty Next 50 TRI Nifty Midcap 150 TRI Nifty Next 50 TRI Data as on March 31, 2022. Source: NSE, MFI Explorer. Bloomberg. $ As per list published by Association of Mutual Funds in India in December-’21 for the period July to December 2021 with reference to Securities and Exchange Board of India circular number SEBI/HO/IMD/DF3/CIR/P/2017/114 dated 6.10.17 on categorization and rationalization of Mutual Fund Schemes. @ The indices/sectors referred in this literature are not an endorsement by the Mutual Fund and AMC of their soundness or a recommendation to buy or sell at any point of time and are only for reference purpose. ^ NBFCs – Non-Banking Financial Companies. *Period from 01.04.05. +Data points rebase to 10,000. ~Graph is to represent overall movement of indices and not specific to particular time period. ! To calculate drawdown, respective current date closing value of an index is subtracted from historic peak of an index and such value is divided by from historic peak of an index. These data points are graphically presented above. TRI = Total Return Index. 11
Nifty 50 Index Comparison – Returns Point to Point Annualized Returns Growth of Rs. 10,000 54,266 44,449 25% 39,610 37,331 22% 22% 21% 20% 18% Amount in Rs. Returns in % 17% 16% 16% 15% 15% 15% 15% 14% 20,425 14% 20,246 19,734 17,622 17,308 15,934 15,557 12% 14,981 12,505 12,229 12,158 12,026 1 Year 3 Years 5 Years 10 Years 1 Year 3 Years 5 Years 10 Years Period Period Nifty 500 TRI Nifty 50 TRI Nifty Next 50 TRI Nifty Midcap 150 TRI Nifty 500 TRI Nifty 50 TRI Nifty Next 50 TRI Nifty Midcap 150 TRI Monthly Investment 32,73,022 Annualized Returns Growth of Rs. 10,000 26,86,267 26,81,959 25,91,099 34% 26% 24% Amount in Rs. 23% Returns in % 21% 19% 9,99,503 18% 9,32,879 9,26,377 18% 8,59,164 16% 16% 16% 16% 15% 15% 15% 5,66,074 5,16,752 5,02,567 4,93,475 11% 1,28,573 1,26,030 1,28,719 1,28,034 1 Year 3 Years 5 Years 10 Years 1 Year 3 Years 5 Years 10 Years Period Period Nifty 500 TRI Nifty 50 TRI Nifty Next 50 TRI Nifty Midcap 150 TRI Nifty 500 TRI Nifty 50 TRI Nifty Next 50 TRI Nifty Midcap 150 TRI Data as on March 31, 2022. TRI i.e. ‘Total Return Index consider dividend issued by companies forming part of Index. Source: MFI Explorer. Returns are calculated considering last working day of the month. Returns over one year are of compounded annualized growth rate (CAGR). In case of monthly investment, we have assumed Rs.10,000 invested at month end closing price of total return index. Monthly return is calculated considering RATE() function in MsExcel. Such monthly return is annualized. Investors cannot invest directly into an index. However, they can expect similar returns using ETF or Index Fund, subject to tracking error and cost. Returns over one year are of compounded annualized growth rate (CAGR). 12
About UTI Nifty Next 50 Index Fund Type of scheme Plans & Options@ Entry and Exit Load* An Open-ended scheme replicating/tracking Nifty Next 50 Index Regular and Direct plans with Growth option NIL Inception Market Cap Exposure* June 28, 2018 Large Cap – 81% Mid Cap – 19% Small Cap - Nil * As on December 31, 2021. @ Under UTI Nifty Next 50 Index Fund in addition to regular, there is a direct plan. Both plan offers only growth option and other options like dividend payout and dividend reinvestment etc. are not available. For more details please read Scheme Information Document. 13
Why UTI Nifty Next 50 Index Fund? Asset Under Management (AUM), Total Expense Ratio (TER) and Tracking Error (TE) are critical aspects while selecting any ETF or Index Fund. Asset Under Management (Size)@ Total Expense Ratio (Cost)#$ One Year Tracking Error# 1,631 0.16% 0.16% 0.87% 0.79% Tracking Error in % AUM in Rs. Crs. TER in % 0.07% 0.06% 0.33% 0.31% 418 Direct Regular Direct Regular UTI Avg. AUM of other funds tracking Nifty Next 50 UTI Avg. tracking error of other funds tracking Nifty Next 50 UTI Avg. TER of other funds tracking Nifty Next 50 Large size Competitive Cost Lowest Tracking Error Source: MFI Explorer @ Month End Asset under management in Rs. Crs. for the month March 2022 # As on March 31, 2022 $ May change in future within the limits and rules prescribed by SEBI from time to time. UTI – UTI Nifty Next 50 Index Fund. Direct refers to Direct Plans offered under mutual fund schemes and Regular refers to regular plans. Only growth options are considered for the analysis. Various schemes may broadly offer, dividend payout and dividend reinvestment options in addition to growth option. Please read Scheme Information Document and other statutory documents of respective schemes for more details. 14
REGISTERED OFFICE: UTI Tower, ‘GN’ Block, Bandra Kurla Complex, Bandra (E), Mumbai - 400051.Phone: 022 – 66786666. UTI Asset Management Company Ltd (Investment Manager for UTI Mutual Fund) Email: invest@uti.co.in . (CIN-U65991MH2002PLC137867). For more information, please contact the nearest UTI Financial Centre or your AMFI/NISM certified UTI Mutual Fund Independent Financial Advisor (IFA) for a copy of the Statement of Additional Information, Scheme Information Document and Key Information Memorandum cum Application Form. Disclaimers: The information on this document is provided for information purposes only. It does not constitute any offer, recommendation or solicitation to any person to enter into any transaction or adopt any hedging, trading or investment strategy, nor does it constitute any prediction of likely future movements in rates or prices or any representation that any such future movements will not exceed those shown in any illustration. Users of this document should seek advice regarding the appropriateness of investing in any securities, financial instruments or investment strategies referred to on this document and should understand that statements regarding future prospects may not be realized. The recipient of this material is solely responsible for any action taken based on this material. Opinions, projections and estimates are subject to change without notice. UTI AMC Ltd is not an investment adviser, and is not purporting to provide you with investment, legal or tax advice. UTI AMC Ltd or UTI Mutual Fund (acting through UTI Trustee Company Pvt. Ltd) accepts no liability and will not be liable for any loss or damage arising directly or indirectly (including special, incidental or consequential loss or damage) from your use of this document, howsoever arising, and including any loss, damage or expense arising from, but not limited to, any defect, error, imperfection, fault, mistake or inaccuracy with this document, its contents or associated services, or due to any unavailability of the document or any part thereof or any contents or associated services. Mutual Fund Investments are subject to market risks, read all scheme related documents carefully