Download
1 / 58
1.43k likes | 4.14k Views
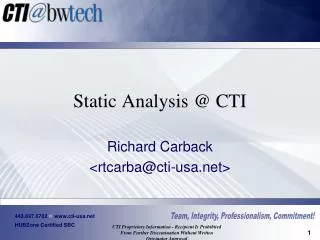
Static Pushover Analysis. Performance Based Design Modeling for Pushover Analysis Use of the Pushover Curve M. Iqbal Suharwardy Computers and Structures, Inc. Static Pushover Analysis for Seismic Design March 22, 1999. Performance Check of Structures. Purpose

E N D
Static Pushover Analysis Performance Based Design Modeling for Pushover Analysis Use of the Pushover Curve M. Iqbal Suharwardy Computers and Structures, Inc. Static Pushover Analysis for Seismic Design March 22, 1999
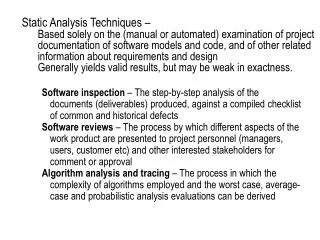
Performance Check of Structures • Purpose • How will a structure perform when subjected to a given level of earthquake? • Definition of structural performance • Definition of earthquake level • Determination of performance level
Performance Check of Structures • Process • Recently released guidelines for Seismic Rehabilitation of Buildings: • ATC-40 • FEMA 273 (ATC-33)
Types of Performance Checks • Linear Static Analysis • Linear Dynamic Analysis • Nonlinear Static Analysis(Pushover Analysis) • Nonlinear Dynamic Analysis
Performance Check Using Pushover Expected Performance Point for given Earthquake Force Measure Performance Limits (IO, LS, CP) Deformation Measure Goal is to predict peak response of building and components for a given earthquake
Why Do Pushover Analysis? • Design Earthquakes cause nonlinear behavior • Better understand building behavior- Identify weak elements- Realistic prediction of element demands • Less conservative acceptance criteria can be used with consequences understood
Steps in Performance Check • Construct Pushover curve • Select earthquake level(s) to check • Select performance level(s) to check • Select acceptance criteria for each performance level • Verify acceptance • Capacity Spectrum Method (ATC-40) • Displacement Coefficient Method (FEMA 273)
Constructing Pushover Curve • Define Structural Model • Elements (components) • Strength - deformation properties • Define Loads • Gravity • Lateral load pattern • Select Control Displacements or Drifts • Perform Pushover Analysis
Pushover Modeling Definition of Structural Model • 3D or 2D • Primary and Secondary Elements (components) • Non structural Elements • Foundation flexibility • P-Delta effects
Pushover Modeling (Elements) • Types • Truss - yielding and buckling • 3D Beam - major direction flexural and shear hinging • 3D Column - P-M-M interactionand shear hinging • Panel zone - Shear yielding • In-fill panel - Shear failure • Shear wall - P-M-Shear interaction! • Spring - for foundation modeling
Pushover Modeling (Properties) Force-Deformation Relationship C B Force D E A Deformation
Pushover Modeling (Properties) Force-Deformation (Back bone Curve) Force Deformation
Pushover Modeling (Beam Element) Three dimensional Beam Element Flexible Connection Span Loads Shear Hinge Plastic Hinge Rigid Zone
Pushover Modeling (Column Element) Three dimensional Column Element Shear Hinge Plastic Hinge Rigid Zone
Pushover Modeling (Column Element) Axial Load - Moment Interaction (Concrete) P M
Pushover Modeling (Column Element) Axial Load - Moment Interaction (Steel)
Pushover Modeling (Loads) • Start with Gravity Loads • Dead Load • Some portion of Live Load • Select Lateral Load Pattern • Lateral Load Patterns (Vertical Distribution) • Lateral Load Horizontal Distribution • Torsional Effects • Orthogonal Effects
Pushover Modeling (Loads) Lateral Load Patterns (Vertical Distribution) Mode 1 Code Lateral Uniform
Pushover Analysis (Control) • Force controlled analysis • Deformation controlled analysis • Roof Displacement • Generalized Displacement Definitions • Limit of analysis • Instability - loss of gravity load carrying capacity • Excessive distortions
Pushover Analysis (Solution Schemes) • Event by Event Strategies • Manual • Newton-Raphson Type Strategies • Constant stiffness iterations • Tangent stiffness iterations • Problem of degradation of strength • Ritz Modes (Reduced Space) Strategies
Pushover Analysis (Solution Schemes) Event by Event Strategy Base Shear Roof Displacement
Pushover Analysis (Solution Schemes) Problem of Degradation of Strength Base Shear Roof Displacement
Pushover Analysis (Results) Force Measure Deformation Measure
Use of Pushover Curve • Capacity Spectrum Method - detailed in ATC-40 - and as alternate method in FEMA-273 • Displacement Coefficient Method - detailed in FEMA-273
Use of Pushover Curve (ATC-40) • Construct Capacity Spectrum • Estimate Equivalent Damping • Determine Demand Spectrum • Determine Performance Point • Verify Acceptance
Use of Pushover Curve (ATC-40) Constructing Capacity Spectrum Spectral Acceleration Base Shear Roof Displacement Spectral Displacement
Use of Pushover Curve (ATC-40) Constructing Capacity Spectrum The displaced shape at any point on the pushover curve is used to obtain an equivalent SDOF system. a is the mass participation and relates the base shears PF is the participation factor and relates the roof displacement to the SDOF displacement Equivalent SDOF MDOF
Use of Pushover Curve (ATC-40) Constructing Capacity Spectrum Spectral Acceleration Spectral Displacement
Use of Pushover Curve (ATC-40) Estimation of Equivalent Viscous Damping Spectral Acceleration Spectral Displacement
Use of Pushover Curve (ATC-40) Estimation of Equivalent Damping Spectral Acceleration Eso Spectral Displacement Ed
Use of Pushover Curve (ATC-40) Response Spectrum (5% damping) 2.5CA CV/T Spectral Acceleration Time Period
Use of Pushover Curve (ATC-40) • Response Spectrum (5% damping) • CA and CV depend on: • - Seismic zone (0.075 to 0.4) • - Nearness to fault and source type (1 to 2) • - Soil Type (1 to 2.5) • - Level of Earthquake (0.5 to 1.5)
Use of Pushover Curve (ATC-40) Reduced Spectrum (Effective damping) 2.5CA/Bs Spectral Acceleration CV/(T BL) Time Period
Use of Pushover Curve (ATC-40) Acceleration-Displacement Response Spectrum T0 Sd = SaT2/4p2 Spectral Acceleration Spectral Acceleration T0 Spectral Displacement Time Period
Use of Pushover Curve (ATC-40) Performance Point Demand Spectrum for effectivedamping at performance point Spectral Acceleration Capacity Spectrum Spectral Displacement
Use of Pushover Curve (ATC-40) Performance Point Spectral Acceleration Spectral Displacement
Use of Pushover Curve (ATC-40) Verification of Acceptance Expected Performance Point for given Earthquake Force Measure Performance Limits (IO, LS, CP) Deformation Measure
Use of Pushover Curve (FEMA-273) • (Displacement Coefficient Method) • Estimate Target Displacement • Verify Acceptance
Use of Pushover Curve (FEMA-273) • Estimation of Target Displacement • Estimate effective elastic stiffness, Ke • Estimate post yield stiffness, Ks • Estimate effective fundamental period, Te • Calculate target roof displacement as
Use of Pushover Curve (FEMA-273) • Estimation of Target Displacement • C0 Relates spectral to roof displacement • C1 Modifier for inelastic displacement • C2 Modifier for hysteresis loop shape • C3 Modifier for second order effects
Use of Pushover Curve (ATC-40) Estimation of Effective Elastic Period, Te Vy aKe = Ks Estimate Te using Ke Estimate Elastic Spectral Displacement .6Vy Base Shear Ke Roof Displacement
Use of Pushover Curve (FEMA-273) • Calculation of C0 • Relates spectral to roof displacement • - use modal participation factor for control node from first mode • - or use modal participation factor for control node from deflected shape at the target displacement • - or use tables based on number of stories and varies from 1 to 1.5
Use of Pushover Curve (FEMA-273) • Calculation of C1 • Modifier for inelastic displacement C1 = [1 +(R-1)T0/Te]/R R is elastic strength demand to yield strength Spectral Acceleration C1 = 1 T0 Time Period
Use of Pushover Curve (FEMA-273) • Calculation of C2 • Modifier for hysteresis loop shape • - from Tables • - depends on Framing Type (degrading strength) • - depends on Performance Level • - depends on Effective Period • - varies from 1.0 to 1.5
Use of Pushover Curve (FEMA-273) • Calculation of C3 • Modifier for dynamic second order effects • C3 = 1 if post yield slope, a is positive • else • C3 = 1 +[ |a|(R-1)3/2 ]/Te
Use of Pushover Curve (FEMA-273) Verification of Acceptance Target Displacement (or corresponding deformation) for given Earthquake Force Measure Performance Limits (IO, LS, CP) Deformation Measure
Use of Pushover Curve • Do these methods work? • Comparisons with: • - Nonlinear time history analysis • - Single degree of freedom systems • - Multi-degree of freedom systems • - Observed damage • How do they compare with each other?
SAP2000/ETABS Pushover Options • SAP2000 released September, 1998 • Full 3D implementation • Single model for - linear static analysis - linear response spectrum analysis - linear time history analysis - nonlinear time history analysis - nonlinear static pushover analysis - steel and concrete design