Download
1 / 15
0 likes | 5 Views
Visualpath provides top-notch Power BI Training, available globally in regions such as the USA, UK, Canada, Dubai, Australia, and Hyderabad. This all-encompassing course covers data modeling, DAX, Power Query, visualization techniques, and integration with SQL and Azure, equipping you with essential skills in data analytics and business intelligence. Whether youu2019re looking for Power BI Online Training or in-person sessions in Hyderabad, weu2019ve got you covered. Take the first step toward mastering Power BIu2014book your free demo now at 91-9989971070!<br>WhatsApp: https://www.whatsapp.com/catalog/9199

E N D
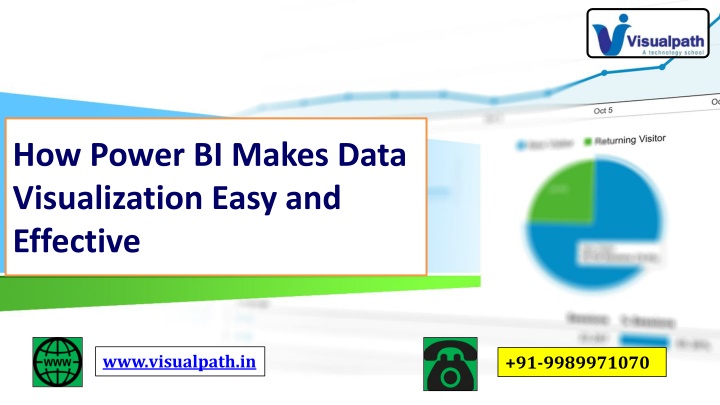
How Power BI Makes Data Visualization Easy and Effective www.visualpath.in +91-9989971070
Introduction • Power BI, a powerful business analytics tool from Microsoft, has transformed the way organizations handle data visualization. • With its user-friendly interface and advanced features, Power BI empowers businesses to make informed decisions by presenting data in clear, interactive, and visually appealing formats. • This presentation delves into how Power BI simplifies data visualization and makes it highly effective. www.visualpath.in +91-9989971070
Data Source Integration • Connects with diverse data sources such as Excel, SQL Server, and cloud platforms. • Enables real-time data updates for accurate insights. • Reduces dependency on manual data entry processes. www.visualpath.in +91-9989971070
User-Friendly Interface • Drag-and-drop functionality for easy report creation. • Customizable dashboards to suit specific business needs. • Simple navigation for both beginners and advanced users. www.visualpath.in +91-9989971070
Data Modelling Features • Supports relationships between multiple data tables. • Offers DAX (Data Analysis Expressions) for complex calculations. • Enables quick transformations and adjustments within datasets. www.visualpath.in +91-9989971070
Visualization Options • Provides a variety of charts, graphs, and maps for diverse data types. • Allows users to create custom visualizations through external libraries. • Interactive elements such as slicers enhance user engagement. www.visualpath.in +91-9989971070
Collaboration Tools • Facilitates report sharing via Power BI Service. • Enables co-authoring and feedback collection on shared dashboards. • Integrates with Microsoft Teams for enhanced collaboration. www.visualpath.in +91-9989971070
Mobile Accessibility • Power BI Mobile App ensures access to reports on the go. • Dashboards are optimized for mobile viewing. • Real-time alerts keep users updated on critical data changes. www.visualpath.in +91-9989971070
AI Integration • Features built-in AI visualizations for predictive analytics. • Integrates with Azure Machine Learning for advanced insights. • Offers Q&A functionality for natural language queries. www.visualpath.in +91-9989971070
Security Features • Incorporates robust data encryption to safeguard information. • Adheres to global compliance standards like GDPR and HIPAA. • Admin tools allow role-based access control for secure sharing. www.visualpath.in +91-9989971070
Cost-Effective Solution • Offers a range of pricing plans to suit varying business sizes. • Eliminates the need for expensive hardware or software installations. • Scales effectively with growing organizational needs. www.visualpath.in +91-9989971070
Regular Updates • Regular updates bring new features and enhancements. • Extensive online documentation and community forums for troubleshooting. • Dedicated support from Microsoft ensures a smooth user experience. www.visualpath.in +91-9989971070
Conclusion • Power BI stands out as a leader in data visualization tools, offering unparalleled ease of use and effectiveness. • From its seamless integration capabilities to advanced AI-powered insights, it provides businesses with the tools needed to transform raw data into actionable insights. • Organizations leveraging Power BI can drive better decisions, foster collaboration, and achieve greater efficiency in their data-driven processes. www.visualpath.in +91-9989971070
CONTACT For More Information About Power BI Address:- Flat no: 205, 2nd Floor, Nilgiri Block, Aditya Enclave, Ameerpet, Hyderabad-16 Ph. No: +91-9989971070 Visit:www.visualpath.in E-Mail:online@visualpath.in
Thank You www.visualpath.in