Download
1 / 15
150 likes | 247 Views
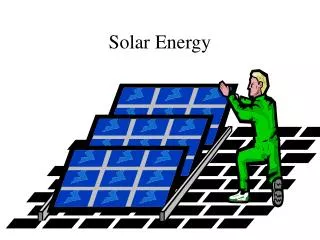
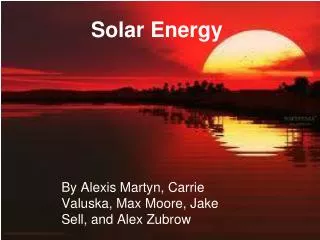
“State of Solar” Energy in the U.S. Kathy Jack Environmental Science University of North Texas October 4, 2014. http:// www.hdpaperwall.com /sunlight/. Solar Energy Technologies. http:// solartribune.com. Jarlanbah EcoVillage , Nimbin , Australia.

E N D
“State of Solar” Energy in the U.S. Kathy Jack Environmental Science University of North Texas October 4, 2014 http://www.hdpaperwall.com/sunlight/
Solar Energy Technologies http://solartribune.com Jarlanbah EcoVillage, Nimbin, Australia. Red Oak Subdivtision. Boulder,CO. http://www.lighthousesolar.com/ Soalr One, Barstow, CA. http://solartribune.com/solar-power-plants/
U.S. Primary Energy Consumption by Source (2000-2013) .06% .1% .3% Solaras % total .03% U.S. Energy Information Administration. Monthly Energy Review. September 2014. http://www.eia.gov/totalenergy/data/monthly/#summary
Cumulative Solar by Technology (2013) 11.74 GW AC .4% total U.S. electricity Interstate Renewable Energy Council (IREC).U.S. Solar Market Trends 2013 (2014); GWDCderated by 13.% as recommended by Larry Sherwood, IREC (Oct 2014).
New Electric Generation by Technology 2012 2013 PTC was slated to end 12/12, but extended by American Taxpayer Relief Act 0f 2012 USEIA and IREC in U.S. Solar Market Trends 2012. 2013:5 and U.S. Solar Market Trends 2013, 2014: 6.
Cumulative Installed GPV in U.S. 82% of cumulative GPV installed in last 3 years! Interstate Renewable Energy Council (IREC).U.S. Solar Market Trends 2013 (2014:8).
Annual Installed GPV by Sector (2003-2012) Interstate Renewable Energy Council (IREC).U.S. Solar Market Trends 2012. 2013: 12.
Annual Installed GPV by Sector (2009-2013) 34% increase Total 47% increase in utility 92% PPA 8% decrease 68% increase in residential Increase in leases Interstate Renewable Energy Council (IREC).U.S. Solar Market Trends 2013. 2014: 12
Top 10 States - Annual PV Installation Capacity Interstate Renewable Energy Council (IREC).U.S. Solar Market Trends 2013 (2014:17).
PV Leases - California Source: U.S. Energy Information Administration, based on California Solar Initiative data at USEI, http://www.eia.gov/todayinenergy/detail.cfm?id=12991.
538 utility or gov.rebates • Workforce development • Financing • Ownership models Trends/Drivers EPA 2005 E.R.S.A 2008 A.R.R.A 2009 RPS- 37 33 A’s/B’s Net Metering 26 12 RPS- 20 A’s/B’s Interconnection 2 Installed Cost- LBNL Tracking the Sun VII; Annual Installed PV Capacity- IREC Solar Market Trends 2013; Freeing the Grid:http://freeingthegrid.org/; WRI Bottom Line on Renewable Energy Tax Credits: http://www.wri.org/publication/bottom-line-renewable-energy-tax-credits
Installed Cost of PV 44% in 4 years 11% LBNL. Tracking the Sun VII (2014). http://www.pvsolarreport.com/lbnl-report-shows-decreasing-soft-costs-of-solar/
Annual Installed CPS in U.S. (2009-2013) GW DC 900 800 700 600 500 400 300 200 100 0 The most CSP capacity ever installed in U.S. in a single year 3 new CSP plants 2009 2010 2011 2012 2013 2009
On the Horizon • Continued work on Soft Costs • Continued Growth expected • Grid Saturation • Technical • Loss revenue
Key Sources • Interstate Renewable Energy Council (IREC). • www.irec.com • U.S. Solar Market Trends 2013. (also 2009-20012) • Database for State Incentives for Renewables and Efficiency (DSIRE). IREC, USDOE, NCSC. • http://www.dsireusa.org/ • U.S. Energy Information Administration. • www.eia.gov • Monthly Energy Review. • Freeing the Grid: http://freeingthegrid.org/