Download
1 / 20
210 likes | 474 Views
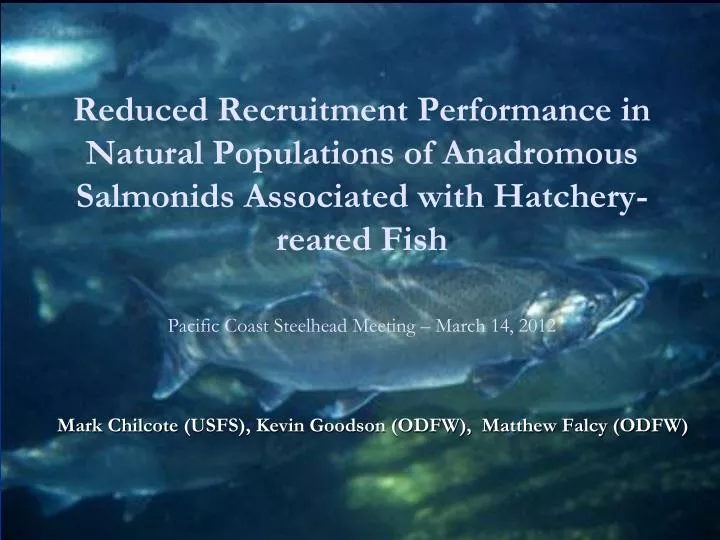
Reduced Recruitment P erformance in N atural Populations of A nadromous S almonids Associated with Hatchery-reared F ish Pacific Coast Steelhead Meeting – March 14, 2012. Mark Chilcote (USFS), Kevin Goodson (ODFW), Matthew Falcy (ODFW). Oregon Recovery Planning.

E N D
Reduced Recruitment Performance in Natural Populations of AnadromousSalmonids Associated with Hatchery-reared FishPacific Coast Steelhead Meeting – March 14, 2012 Mark Chilcote (USFS), Kevin Goodson (ODFW), Matthew Falcy (ODFW)
Oregon Recovery Planning Quantitatively describe threat impacts to viability Hatchery threat difficult to describe Literature review of limited help
Studies of Reproductive Success (RSh) • Number of offspring produced per hatchery spawner relative to number produced per wild spawner • Evidence from 3 studies (all steelhead): • Leider et al 1990 (Kalama River) • McLean et al 2003 (Forks Crk, Washington) • Araki et al 2007 (Hood River) • RSh averaged about 0.10 for segregated stocks and 0.60 for integrated stocks
Supposition IF reproductive success of hatchery fish (RSh) spawning in the wild is low, THEN, should see evidence of this from recruitment performance
Relationship from Chilcote 2003* * Chilcote, M.W. 2003. Relationship between natural productivity and the frequency of wild fish in mixed spawning populations of wild and hatchery steelhead (Oncorhynchus mykiss). Can. J. Fish. Aquat. Sci. 60: 1057-1067
2011 Analysis – Key Questions • Does relationship hold for all populations? • Does it apply to other species (coho and Chinook)? • Is it sensitive to type of hatchery fish? • Integrated versus Segregated
Two-Step Process • Estimate intrinsic productivity through fitting recruitment curves to data sets • Determine what variables (covariates) account for most of the variation in intrinsic productivity
Recruitment Model Fits • Looked at 93 populations • From Washington, Oregon, Idaho • Fit recruitment model for 89 of these • Therefore, intrinsic productivity estimated • Chinook (37), steelhead (29), and coho (23)
Step Two • Develop productivity models with multiple covariates • Compare models • Identify model that best explains variability
Covariates • Species • Hatchery location • Hatchery program type (integrated/segregated) • Hatchery legacy • Dams • Proportion hatchery spawners (Ph)
Best Model Covariates Best model did not include hatchery type or legacy
Chinook – Coho – Steelhead - Modeled Relationship
Findings • The model explained 72% of the variability in the data • The slope suggests that productivity of 100% hatchery fish is 13% that of 100% wild fish • There was no relationship with integrated versus segregated broodstocks
Mechanism(s) Unknown • Analyses didn’t identify mechanisms • Maybe a combination of: • Plausible RSh levels (segregated RSh = 0.10) • Ecological effects • Multigenerational accumulation of adverse impacts • Note that analysis is not for single generation but for a period of 20 years (4 to 6 generations).
For Consideration • If: • Impact from segregated or integrated is the same, • Loss of fitness Araki and others found is universal, • Ph would be the same regardless, and • Hatchery program is for harvest; • Should you choose integrated?
Integrated Harvest Programs Pros Cons Reduces fitness in one generation Difficult to meet goals consistently More effort required to collect brood Requires mining of wild population • Maintains genetic similarity to wild population • Mimics wild run timing • Anglers love them
A Hypothesis to Explore Naturally spawning integrated fish appear to produce more offspring than segregated Could lead to more F1s, F2s to interbreed with wild population Might lead to more alteration of the genetic composition of wild population Fishery benefits could be maintained by managing run timing of segregated broodstock Might be better off with segregated programs