Download
1 / 19
190 likes | 417 Views
Web Services and Visualisation. Lakshmi Sastry, Srikanth Nagella, Ronald Fowler and Vasanthi Nagalingam Applications and Visualisation Group e-Science Centre CCLRC, UK For further information please contact: m.sastry@rl.ac.uk. Presentation Overview. Visualisation pipeline – a definition

E N D
Web Services and Visualisation Lakshmi Sastry, Srikanth Nagella, Ronald Fowler and Vasanthi Nagalingam Applications and Visualisation Group e-Science Centre CCLRC, UK For further information please contact: m.sastry@rl.ac.uk Lakshmi Sastry
Presentation Overview • Visualisation pipeline – a definition • Grid enabled visualisation – why? • Various methods of achieving it • GAPtk architecture • The Web Services interface • Current Services forGODIVA • Example portals Lakshmi Sastry
Visualisation techniques Filtering Visualisation Raw data Mapping • Filtering is application specific – increasingly user defined • Mapping on to abstract visualisation objects • compute intensive • complex (client-side/server side) • Solved problem in isolation but problematic in the context of data analysis. Lakshmi Sastry
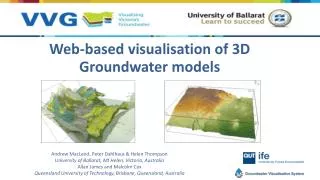
Grid Enabled Visualisation • Grid enabled visualisation is the implementation of visualisation techniques to support near real-time interactivity for very large data sets. • visualisation techniques to support variety and quantity of data • control Client-side vs server side rendering for quality and purpose • interface to data, application and compute resources on the Grid • make available these via domain specific application or portal front-end • develop APIs for sensible handling of visualisation using web services interface Lakshmi Sastry
Visualisation on the Grid • Vertical software, application specific, passive (images and movies), view independent (server-side rendering) • Post-processing visualisation tools • Grid enabled post-processing visualisation • CCLRC visualisation services and portals toolkit GAPtk • extends the above to a generic, open and extensible • bottom up approach, re-implementing visualisation algorithms to improve performance • Grid/Web services based interface to the services • server-side rendering where required • Output in OpenGL, XML, netCDF, VTK, Matlab formats Lakshmi Sastry
Architecture Lakshmi Sastry
Realisation of the architecture • A generic toolkit (GAPtk) with • a set of visualisation services to support real-time data exploration • server-side animation generation • publishing quality postscript generation • coordinate transformation services • isosurface generation (structured and unstructured data) • slices, streamline and vortex computations • ability to choreograph complex overlays of visualisation scenarios Lakshmi Sastry
Realisation of the architecture(2) • A generic toolkit with • a set of data management services • access third party data services • specific data formats • client-side library to handle output semantically correctly • data filtering for efficiency Lakshmi Sastry
Realisation of the architecture (3) • A generic toolkit with • application services • monte-carlo simulation • least square fitting • on-the-fly derived quantities computations • ability to browse and dynamically link applications and Web/Grid services • ability to add application modules • a client-side library for communication, data handling and interaction, scripting Lakshmi Sastry
Example clients Prototype GAPtk/GODIVA services have been used in a number of client systems, including: • Java/Swing based (Godiva client) • FLTK – OpenGL (GAPtk client) • Java3D ( RAVE) • MATLAB (EVE visualisation) Lakshmi Sastry
Prototype implementation - Clients • GODIVA client • Java / Swing based • Designed for 2d, 3d (4d) oceanographic data • Available for download Lakshmi Sastry
Prototype implementation - Clients • FLTK-OpenGL client Lakshmi Sastry
Architecture for FLTK client Godiva client 1 GADS data server 2 3 Myproxy server 4 NGS server Oxford NGS server Ral Lakshmi Sastry Godiva Vis’ server
Prototype implementation - Clients • GODIVA services in RAVE user interface Lakshmi Sastry
Prototype implementation - Clients • MATLAB-client Lakshmi Sastry
Prototype implementation - Clients • Services browser • Provides overview of services • Can call all services and download data • Useful for building workflow Lakshmi Sastry
Client-side flexibility • Any application/domain specific familiar front-end tool can be used (IRIS Explorer, Matlab, IDL, VTK, Java, Web browser) • Preserves existing knowledge and familiarity • Adds functionality incrementally • Usable for applications that do not need the Grid • Grid or Web Services protocol is used for communication as required • E.g. Use of GEODISE Compute Toolbox, CoG • Transparent use of the Grid resources • Upload user data and application modules • No need to learn complex Grid APIs Lakshmi Sastry
Benefits of this approach Address the scalability requirements of scientific applications visualisation using Grid and Web services technology. Preserve the research and development investment made by scientific communities in developing applications that form part of their everyday scientific activity. Improve the support for near-real time data exploration of VERY large datasets thereby support productivity. Lakshmi Sastry
Future work • Currently working on integration of service into CDAT (climate data analysis tool). • EVE (e-Science Visualisation Environment) will use GAPtk services for data analysis. • Developing parallel visualisation methods for cluster based systems such as NGS. • Additional funding at CCLRC to develop GAPtk. Lakshmi Sastry