Download
1 / 38
400 likes | 556 Views
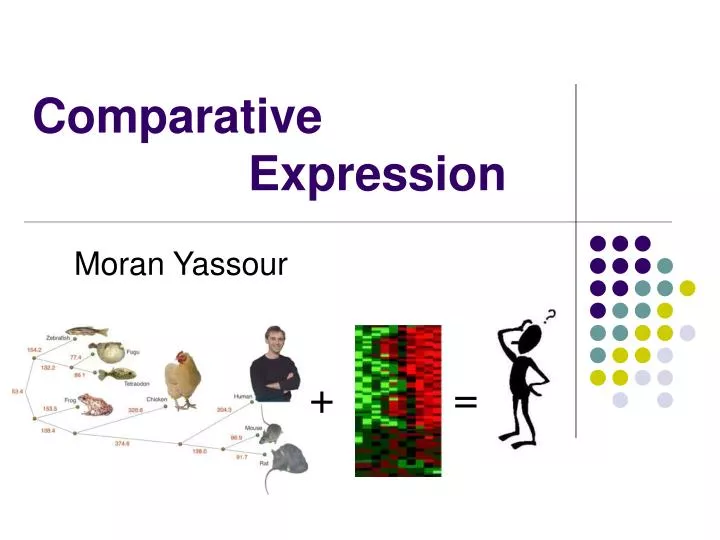
Comparative Expression. Moran Yassour. +. =. Goal. Build a multi-species gene-coexpression network Find functions of unknown genes Discover how the genes interact Distinguish between accidentally regulated genes from those that are physiologically important.

E N D
Comparative Expression Moran Yassour + =
Goal • Build a multi-species gene-coexpression network • Find functions of unknown genes • Discover how the genes interact • Distinguish between accidentally regulated genes from those that are physiologically important
Construction of a gene-coexpression network. • Evolutionarily diverse organisms with extensive microarray data: • Homo sapiens • Drosophila melanogaster • Caenorhabditis elegans • Saccharomyces cerevisiae. • We first associated genes from one organism with their orthologous counterparts in other organisms.
Evolution 101 • Paralogs vs. Orthologs
Evolution 101 • Paralogs vs. Orthologs
MEG Construct a metagene • Using this method, we assigned each gene to at most a single metagene. identify connected components ignore non-reciprocal hits Human gene Worm gene best BLAST hit Fly gene Yeast gene
Some numbers • In total we have 6307 metagenes (6591 human genes, 5180 worm genes, 5802 fly genes, and 2434 yeast genes.) • We sought to identify pairs of metagenes that not only were coexpressed in one experiment and in one organism but that also showed correlation in diverse experiments in multiple organisms.
MEG1 ? MEG2 2 4 2 Edges in the graph Human Fly Worm 1 5 1 5 3 2 4 2 4 3 4 5 2 1 3 MEG1 MEG2 {2,4,2} significant ? (P-value <? 0.05) draw an edge
Statistical tests (1) – permuted metagenes • Construction of a network from a set of permuted metagenes (random collection of genes from each organism) • At P < 0.05, the real networks contained 3.5 ± 0.03 times as many interactions as the random networks contained
Statistical tests (2) – half the data • Split microarray data into halves two networks • We then counted the fraction of interactions that were significant in one network (P < 0.05), given that they were significant in the other network at P < p for various values of p. • P = 0.05 41% significant expression interactions
Statistical tests (3) – noise stability • We added increasing levels of Gaussian noise to the entire data set for each of the organisms. Noise negative log P-value Real network negative log P-value
Visualization • x-y plane – negative logarithm of P value • K-means clustering • z axis – density of genes in the region
Example – Component 5 • A total of 241 metagenes • 110 of which were previously known to be involved in the cell cycle. • 202 cell cycle metagenes in the network. • P-value < 10-85 • Of the 241 cell cycle metagenes: • 30 – regulating the cell cycle. • 80 – terminal cell cycle functions. • 131 – unknown.
Experimental validation (1) – expression data • Five metagenes with a significant number of links to known cell proliferation genes. • Measuring expression levels in dividing pancreatic cancer cells and in nondividing normal cells.
Experimental validation (2) – loss-of-function mutant • loss-of-function mutant phenotype for one of these genes (C. elegans gene ZK652.1) • RNA interference (RNAi) of ZK652.1 resulted in excess nuclei in the germ line, suggesting that the wild-type function of this gene is to suppress germline proliferation.
Multi-species vs. single species (1) • For each gene (of the five metagenes), we constructed an organism-specific neighborhood. • On average, the neighborhoods of these five genes were over four times more enriched for cell proliferation and cell cycle genes in the multiple-species network than they were in the best single-species neighborhood.
Multi-species vs. single species (2) • Trying to link together • genes that were previously known to be involved in a single function (coverage) • excluding genes not known to participate in that function (accuracy)
Huge data • The multiple-species network was built from more DNA microarray data (3182). • Construction of the network out of only 979 DNA microarrays (as in the worm data set) gave similar results.
Summary - Multi is good • We map only genes that have orthologs in other species and thus focuses strongly on core, conserved biological processes; • Interactions in the multiple-species network imply a functional relationship based on evolutionary conservation. • Nice to have – analysis of other components.
Goal • Comparative study of large datasets of expression profiles from six evolutionarily distant organisms:
Goal • Coexpression is often conserved. • Comparing the regulatory relationships between particular functional groups in the different organisms. • Comparing global topological properties of the transcription networks derived from the expression data, using a graph theoretical approach.
Coexpression conservation • Coexpressed groups - yeast transcription modules • For each yeast module we constructed five “homologue modules”.
Refining homologue modules • The signature algorithm identifies those homologues that are coexpressed under a subset of the experimental conditions. • Furthermore, it reveals additional genes that are not homologous with any of the original genes, but display a similar expression pattern under those conditions
Correlation distribution • the distribution of the Z-scores for the average gene–gene correlation of all the “homologue modules”
Subsets of the data • Correlations between the sets of conditions for randomly selected subsets of the data. • Although the data is sparse , the findings reflect real properties of the expression network.
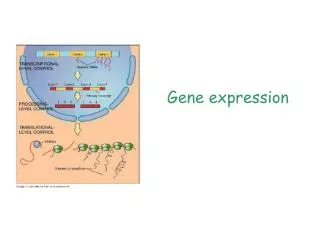
Protein synthesis Decomposition of the expression data • Decomposition of the expression data into a set of transcription modules using the iterative signature algorithm (ISA) • Modules are colored according to the fraction of homologues they possess in the other organism
Connections & Connectivity • Connections between genes of similar connectivity are enhanced (red regions) • Connections between highly and weakly connected genes are suppressed (blue)
Essentiality & Connectivity • The likelihood of a gene to be essential increases with its connectivity.
Homology & Connectivity • The highly connected genes are more likely to have homologues in the other organisms
Summary • Similarity in lower resolution, differences in higher resolution: • All expression networks share common topological properties (scale-free connectivity distribution, high degree of modularity). • The modular components of each transcription program as well as their higher-order organization appear to vary significantly between organisms and are likely to reflect organism-specific requirements.
Future • Gene expression studies • Evolution studies