Download
1 / 57
620 likes | 1.07k Views
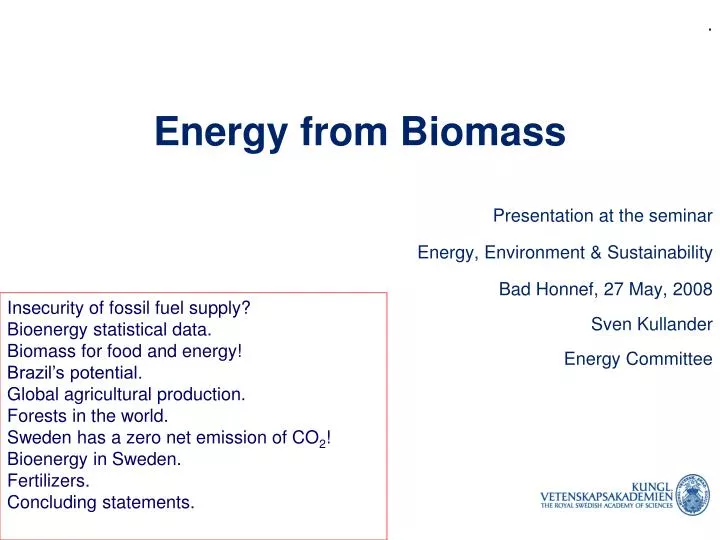
. Energy from Biomass. Presentation at the seminar Energy, Environment & Sustainability Bad Honnef , 27 May, 2008 Sven Kullander Energy Committee. Insecurity of fossil fuel supply? Bioenergy statistical data. Biomass for food and energy! Brazil’s potential.

E N D
. Energy from Biomass Presentation at the seminar Energy, Environment & Sustainability Bad Honnef, 27 May, 2008 Sven Kullander Energy Committee Insecurity of fossil fuel supply? Bioenergy statistical data. Biomass for food and energy! Brazil’s potential. Global agricultural production. Forests in the world. Sweden has a zero net emission of CO2! Bioenergy in Sweden. Fertilizers. Concluding statements.
Production and price of oil $ 100 84Mbd
Security of supply? Not yet developed gas fields
Renewables in 2005 EU – 25GermanySwedenNorwayDenmarkFinland Biomass 4.1% 2.3% 17% 5% 7.1% 15% Hydro 1.5% 0.6% 10% 51% 0% 3.6% Geotherm 0.3% 0% 0% 0% 0% Wind 0.3% 0.7% 0.1% 0% 1.5% 0% Solar 0.04%0%0% 0% 0% 0% 6.3% 3.6% 27% EU target for renewables by 2010 is 12% and by 2020 it is 20%!
Nordic land areas Sweden Norway Finland Denmark EU-25 Germany Aral land (Mha) 2.7 0.87 2.23 2.84 106 13 Forests (Mha) 23.0 7.03 20.3 0.51 137 11
Assumptions about EU-27 bioenergy potential • AEBIOM* assumes that 0.16 hectares/person is enough for food! • EU has 106 Mha agricultural land and 490 million inhabitants. • Thus 32 Mha should be available for bioenergy from agriculture!? • EEA** assumes biomass potential1) is 188 Mtoe (2010), 236 Mtoe (2020). 1) Includes biomass from forestry, agriculture and biowaste and was 72 Mtoe in 2005 *) European Biomass Association (AEBIOM) **) European Environmental Agency (EEA)
Food and energy for a sustainable climate Biomass primarily for food. Electricity for energy.
A Swede eats every year 50 kg greens 15 kg fish 49 kg meat 37 kg bread 65 kg potato 180 kg milk Energy content 3150 MJ = 3150 MWs A person’s power dissipation = 100 watt (1 year is 3,15×10⁷ s) People’s energy needs =6,6×109×3150 MWs = 5 800 TWh/år*) *)Global energy consumption = 125 000 TWh/year
Energy content per kgUnit is mega joule (MJ) Sugar 17 MJ Bread 12 MJ Ham 11 MJ Whisky 10 MJ Compare Ethanol 27 MJ Gasoline 43 MJ
Liquid fuels!? Produced in 2007: 1 billion litres Scotch (40%) from Barley - corresponds to Swedish car ethanol consumption 20 billion litres US ethanol from corn 18 billion litres Brazilian ethanol from sugar cane 1% of world’s motor fuel is ethanol - can it be incresed ten times?
Brazil’s potential* *) From the presentation by Prof. Donato Aranda, Federal Univ. Rio de Janeiro at the seminar Future of Forest Bioenergy, Royal Swedish Engineering Academy of Sciences, Stockholm, 2007
Physical Productivity Source: Brazilian Agricultural Ministry
Sugar Cane production in Brazil *Output/Input Energy ~ 8.2 18 billion litres ethanol on 6 million hectars 0.24 % of global oil production *Donato Aranda, Royal Engineering Academy of Sciences, Stockholm, 2007
Biodiesel ProgramFrom Donato Aranda, February 2007 • B2 mandatory at Jan/2008 (850,000 ton/year) • B5 mandatory at Jan/2010 (2013, originaly) Now: • 10 biodiesel plants working (500,000 ton/year) • 2,000 gas stations providing B2 • Some transportation companies using B30 • Projects: More than 100 new biodiesel plants LOW FEDERAL TAXES FOR SOCIAL PROJECTS AND POOR REGIONS
Soybean Biodiesel (Output/input energy ~ 3)* Biodiversity? Rainforests? Fossil driven! * Donato Aranda, Royal Engineering Academy of Sciences, Stockholm, 2007
Biodiesel from palm oil? Rainforests are cut down
Resources- Raw material- Energy- Land Emissions to- Air- Water- Soil Agriculture Refinement Waste Life Cycleanalysis Transport Consumption Retail
Nitrogen emissions Nitrogen from fertilizers is converted by microbes to nitrous oxide N2O. N2O has a 300 times greater Greenhouse forcing than CO2. IPCC assumes 2 % of nitrogen converted to nitrous oxide. Paul Crutzen et al finds atmosheric pre-industrial N2O value from ice cores. Subtracting from the present atmospheric N2O value gives 3-5 %. Conclusion is that for ethanol from corn and rapeseed, the relative warming due to N2O emission offsets the CO2 saving from the fuel.
Biomass 550 – 835 Gton C 78 Gton C after 1850 CO2 26-28 % of total anthropogenic CO2 originates from aral land! 20 % of photo synthetic bound carbon transported to the soil Land breathing Carbon soil content 1200 – 2200 Gton C After Bengt Lundegårdh
Global agriculture products in 2005UNFood and Agriculture Statistics Global Oulook • Cereals 2,228 million tonnes • Meat 265 million tonnes • Fruits/Vegetables 1,392 million tonnes • Roots/Tubers 712 million tonnes • Pulses 62 million tonnes • Oilseeds/Nuts 146 million tonnes • Sugar Crops 1,532 million tonnes • Tobacco 7 million tonnes • Fibre Crops 29 million tonnes 6,373 million tonnes 1 ton/capita Energy of all this biomass? 16 000 tera watt hours (TWh)
Global energy supply 2005 Total energy production = 125 000 TWh 100% Fossil energy production = 100 000 TWh 80% All agriculture products = 16 000 TWh 13% Food for 6.6 billion people 5 800 TWh*) 5% *) 2.4 kWh/day x 365 x 6.6 x 109 = 5 800 TWh
High productivity of agriculture products requires cultivation with minimum emissions to the environment! But, how to design it?
World´s forestsSource UN-FAO • 4109 hectars forests (30% of surface) • 7.3 106 hectars disappearing each year • In Africa 90% of all wood produced is burnt • 75% of bioenergy comes from forests • Bioenergy represents 80% of renewable energy 1 km2 = 100 hectars (ha)
Change of growing forest stock [Mm3] CountryGrowing stockChange/year Brazil 812 000 -700 China 13 200 +181 Sweden 3155 +24
Nordic forests * USA+Canada 44109 m3 * European Union 13109 m3 ** Germany90106 m3
Sweden’s energy supply 1970 - 2005 Nuclear Hydro Bioenergy Coal Oil
Emissions: mega tonnes 1970 95 Mt CO2 1990 56 Mt CO2 swedish C/CO2 Emissions Remember 56 Mt
Bioenergy in Sweden 2004 TWh TWh Heat 90 Electricity 10 Ethanol 2 Losses 6 Forest 92 Agriculture 4 Peat 4 Waste 8 108 TWh STEM statistics elaborated by Harry Frank
Forests – the major driver of Swedish Economy 36% pulp and paper 23% energy and heat Pulp and papermills 15% chips Skogen, grundbult i svensk välfärd 46% pulp wood 20% wood 46% saw timber Saw mills and board industry 8% bark and sawdust 16% energy and heat 8% firewood Heat production
Forest biomass yield, Sweden, 2004Per-Olov Nilsson, Report 23, 2006, Skogsstyrelsen 21% 19% 26 % 34% 75.9 Mt 380TWh
Use of Swedish forest growth, 2004 76 Mt 380 TWh Fellings 61 Mt Rapport 23 -2006 Per-Olov Nilsson Skogsstyrelsen
Annual growth and fellings, Swedish forests Mil. m3sk (forest cubic metres) Growth Fellings Forest sequestration 1990 was 55 Mt (35 Mm3) Fossil fuel CO2 emissions was 56 Mt Sweden had zero net emission 1990! Källa: Riksskogstaxeringen, Skogsstyrelsen
Biopower plant (During 2005 biopower provided 10 TWh bioenergyin Sweden,1/3 electricity ) • Started operation in 2000 • Building cost 55 Meuros • 0.18 TWh electricity/year • 0.33 TWh heat • 60 trucks firewood/day Eskilstuna biopower plant provides electricity and heat
Two Swedish biofuel alternatives • Ethanol from fermentation of grain or wood including more efficient technologies with enzymes or improved yeast grades* • Production of Synthesis gas, Hydrogen and Carbon monoxide in the right proportions for the subsequent processes (normally well known processes) *) In Norrköping there is ethanol production from wheat providing 20% of Swedish needs
2:nd generation biofuels-Three Swedish Pilot Plants • Ethanol from cellulose by fermentation,Örnsköldsvik. • Biofuels or electricity from black liquor gasification, Piteå. • Synthesis gas from biomass for future biofuels, Värnamo. The objective is to get a production facility within the next 10 years
CHEMREC’S DP-1 facility in PITEÅ for Black Liquor Gasification An arctic circle facility
Black Liquor Gasification - General Scheme Oxygen Air separation Steam Power Gasi- fication and Quench Poly Sulph. Sulphur Management Black liquor Rawgas Gas cooling White liquor Weak wash Gas Purification LS Green liq. Synthesis gas Power & Steam Combined Cycle Synthesis- and Distillation or or DME/Methanol Courtesy: Christer Sjölin
Conclusions on Swedish Ethanol production • Ethanol production from primary biomass is not energy efficient • Technology breakthrough is needed even for second generation fuels • Domestic production is more than twice as expensive as import • A substantial competition for the raw material, wood, will take place, especially if Europe will follow the ethanol route
Black liquor gasification (BLGCC) Conclusions: • Only a smaller portion of the Swedish demand of fuels can be produced from BLGCC probably at high costs and the raw material is in competition with other use. • It is much more likely that electric power production is the best use of the BLGCC technology. The Industry needs all electric power sources which it can get for reasonable power prices in the future.
Fertiliser research • The Flakaliden experimental site (8 ha) is situated 60 km west of Umeå • In 1986 started studies of the growth optimisation of a boreal coniferous forest • Irrigation and fertilisers. Initially 100 kg N/ha + other nutrients (P,K,Ca,S,Mg) • Project leader: Professor Sune Linder