Download
1 / 19
190 likes | 262 Views
A. B. (fold). (fold). IL-4(+). IL-4(+). IL-4(-). IL-4(-). Enrichment against background. Enrichment against background. C. D. Supplementary Figure S1. (fold). (fold). E. F. Enrichment against background. Enrichment against background. H3K4me3. Pol II. H3Ac. H3Ac. H3K4me3.

E N D
A B (fold) (fold) IL-4(+) IL-4(+) IL-4(-) IL-4(-) Enrichment against background Enrichment against background C D Supplementary Figure S1
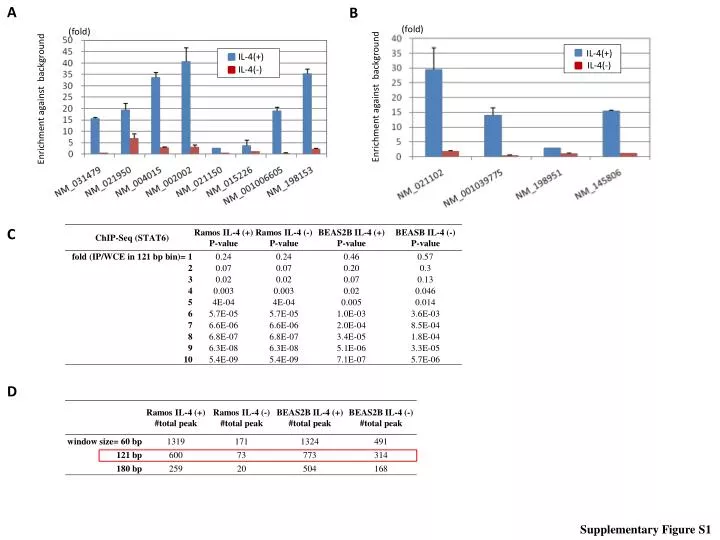
(fold) (fold) E F Enrichment against background Enrichment against background H3K4me3 Pol II H3Ac H3Ac H3K4me3 Pol II G Supplementary Figure S1. Validation of the detected binding sites by independent real time PCR in Ramos cells (A) and BEAS2B (B) cells. Fold enrichment (y-axis) was calculated based on delta Ct method against the non-binding intergenic genomic region for detected STAT6 binding site in each gene. Red and blue bars represent the results from IL-4 (-) and IL-4 (+) experiments, respectively. PCR primers used for each region are shown in (Supplementary Table S2). Estimated false detection rate (C) and number of detected binding sites of STAT6 (D), when different cutoffs were used. (E-G) Similar validation analysis for ChIP Seq analyses of H3K4me3, H3Ac and pol II. Genomic coordinate used for the analyses are shown in Supplementary Table S2. The parameters used in the text are indicated by a red box. WCE: whole cell extract genome used for the background control. Error bars are standard deviations of the triplicate experiments. Supplementary Figure S1
Super Shift Complex Supplementary Figure S2. STAT6 bind to the TCTCGCG sequence in BEAS2B cells. Nuclear protein was extracted from BEAS2B cells with or without IL-4. Left side was used NM_003791 (MBTPS1) probe and right side was used NM_0022913 (GPBP1) probe. Supplementary Figure S2
A B Enrichment against background Enrichment against background C D Supplementary Figure S3
E si-Stat si-GAPDH Enrichment against background F G Supplementary Figure S3
Supplementary Figure S3. Validation Analyses of TSS Seq. Real time RT-PCR validation of the transcripts which were identified as being induced by IL-4 stimulation in Ramos cells (A) and BEAS2B (B) cells. Fold induction of the transcript levels were calculated against GAPDH by delta Ct method. Fold difference evaluated by digital TSS Seq tag counts are shown in the margin for each gene. (C) Mapped positions of the TSS Seq tags relative to the RefSeq genes are shown. %full was calculated as (#“upstream”+#”first exon”+#“intron”)/(#“total tags”) within the RefSeq region. (D) Number of TSCs having the indicated expression levels. (E) Knockdown experiments of STAT6. Knockdown efficiency (y-axis) of each gene was evaluated by real time RT-PCR using delta Ct method against non-targeting siRNA. siRNA used for each experiment is shown in the inset. Sequences of the siRNAs are shown in Supplementary Table S2. (F, G) Evaluation of the TSS Seq libraries constructed using STAT6-knowckdown BEAS2B cells. Error bars are standard deviations of the triplicate experiments. Supplementary Figure S3
A B C D ChIP positive IL4 IgM IL4 110 ChIP & TSS positive IL4 IgM IL4 2 Supplementary Figure S4
E NM_016483 (PHF7) ChIP Seq IL4(+) STAT6 (IP) IL4(+) STAT6 (WCE) TSS Seq IgM(+) IL-4 (+) IgM(+) IL-4 (-) Supplementary Figure S4
Supplementary Figure S4. Identification of STAT6 target in antigen-stimulated Ramos cells. (A) Summary of the ChIP Seq analyses of STAT6. The numbers of peaks detected using the described parameters are shown. (B) Mapped positions of the TSS Seq tags relative to the RefSeq genes are shown. %full was calculated as (#“upstream”+#”first exon”+#“intron”)/(#“total tags”) within the RefSeq region. (C) Number of TSCs having the indicated expression levels. (D) Comparison Ramos IL4(+) and Ramos IgM(+) IL-4(+) peaks. Upper panel was ChIP positive peaks and lower panel was ChIP & TSS positive peaks. (E) Examples of identified STAT6 targets in authentic RefSeq promoter regions in Ramos cells. STAT6 binding sites are indicated by red lines. Expression changes evaluated by digital TSS tag counts are also shown in the bottom margin. Discussion: Interestingly, we compared the targets identified from antigen-stimulated and non-stimulated conditions and found that most of them did not overlap. Particularly, we observed that 20% of ChIP Seq positive sites overlapped, though with rare exceptions, they did not induce the downstream transcriptional initiations. These results also suggested that transcriptional regulations controlled by STAT6 are complex, depending on cellular conditions. Further details will be published elsewhere. Supplementary Figure S4
A ChIP Seq NM_016077(PTRH2) NM_207123(GAB1) STAT6 (IP) STAT6 (WCE) H3K4me3 (IP) H3K4me3 (WCE) H3Ac (IP) H3Ac (WCE) Pol II (IP) Pol II (WCE) TSS Seq IL-4 (+) IL-4 (-) Supplementary Figure S5
Supplementary Figure S5. Examples of identified STAT6 targets. (A) Other examples of the identified STAT6 targets in authentic promoter regions (left panel) and putative alternative regions (right panel) in Ramos cells. Also see the main text. Supplementary Figure S3
A Intermediate Silent target Active target Ramos active chromatin IL-4 (-) pol II transcriptional induction additional factor 1 STAT6 STAT6 IL-4 (+) BEAS2B IL-4 (-) silent chromatin additional factor 2 STAT6 IL-4 (+) Supplementary Figure S6
B NM_078483(SLC36A1) NM_017677(MTMR8) ChIP Seq STAT6 (IP) STAT6 (WCE) H3K4me3 (IP) H3K4me3 (WCE) H3Ac (IP) H3Ac (WCE) Pol II (IP) Pol II (WCE) TSS Seq IL-4 (+) IL-4 (-) Supplementary Figure S6
C NM_078483(Ramos) (497.4) IL-4(+) IL-4(+) (148.1) IL-4(-) IL-4(-) (17.2) (2.6E-05) (44.5) (20.1) (2.9E-05) (10.9) (1) (1) NM_017677(BEAS2B) (43.3) (6.1) (6.3) (1.2) (3) (7.9E-05) (3.1) (1) (1) (6.4E-05) Supplementary Figure S6
Supplementary Figure S6. Chromatin, pol II binding and transcriptional statuses around non-active STAT6 binding sites. (A) Schematic representation of the cases in which the chromosome status and the binding status of pol II are intermediate between active and silent target genes. Right and left panels in (B) exemplify “intermediate” binding sites represented by yellow and red shade boxes in (A), respectively. (C) Upper and lower panels represent results of validation analyses for histone modification patterns, pol II binding statuses and TSS inductions in right and left panels in (B), respectively. Numbers in parentheses represent fold induction compared to background (WCE). Note that we used the same primer set for the real time RT-PCR validations of TSS Seq and observed no positive signals from 1 ng of first strand cDNA used in Supplementary Figure S3. Supplementary Figure S6
A Active Target in Th2 (Ramos) Active Target in Th2(BEAS2B) H3K4me3 H3K4me3 Average tag counts (ppm) Average tag counts (ppm) Distance from TSS(bp) Distance from TSS(bp) H3Ac H3Ac Average tag counts (ppm) Average tag counts (ppm) Distance from TSS(bp) Distance from TSS(bp) Pol II Pol II Average tag counts (ppm) Average tag counts (ppm) Distance from TSS(bp) Distance from TSS(bp) WCE IL-4(-) WCE IL-4(-) ChIP IL-4(-) ChIP IL-4(-) Supplementary Figure S7 ChIP IL-4(+) ChIP IL-4(+) WCE IL-4(+) WCE IL-4(+)
B C Chromatin/pol II status in Ramos Chromatin/pol II status in BEAS2B Supplementary Figure S7. Results of the similar analysis as shown in Figure 3 (A) and Table 2B (B) in Th2 cells. (A) Chromatin and binding statuses of pol II in Ramos cells (left panels) and BEAS2B cells (right panels) around the STAT6 targets which are active in Th2 cells. (B) nd; not determined. Note transcriptional consequences of the STAT6 binding were not specified in the previous paper in Th2 cells. Supplementary Figure S7
A Putative cooperative transcription factors in Ramos Putative cooperative transcription factors in BEAS2B B Supplementary Figure S8. List of the transcription factor candidates which are likely to play roles in cell-type specific transcriptional induction in Ramos cells (A) and BEAS2B cells (B). Statistical significance of the enrichment of the consensus binding sequences in active targets is shown in the second column. Expression level evaluated by digital TSS tag counts is shown in the 5th column. Supplementary Figure S8
Supplementary Table S1. Sequence primers used for the validation analyses. Supplementary Table S1