Download

1 / 41
410 likes | 509 Views
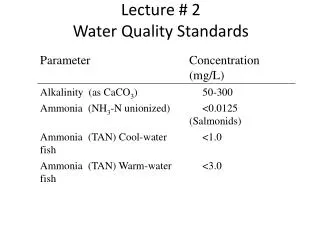
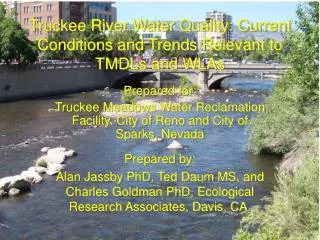
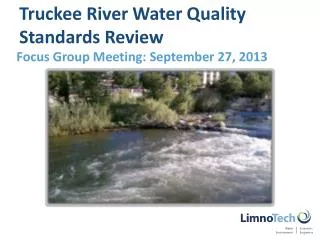
Truckee River Water Quality Standards Review. Focus Group Meeting: August 28, 2013. Recall: Technical Decision Points for Focus Group Input. WQ models: Review Model Confirmation Report and confirm that model calibration is complete and satisfactory (Jul/Aug) WQS modeling process

E N D
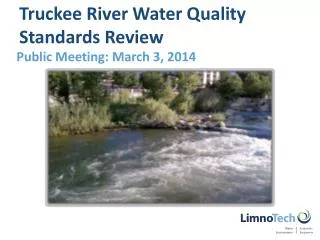
Truckee River Water Quality Standards Review Focus Group Meeting: August 28, 2013
Recall: Technical Decision Points for Focus Group Input • WQ models: Review Model Confirmation Report and confirm that model calibration is complete and satisfactory (Jul/Aug) • WQS modeling process • General approach for analysis (Jul/Aug) • Selection flow years/conditions for analysis (Aug) • Analysis of model results (spatial aggregations, critical reach, critical season/month) (Aug) • Speciation of Phosphorus WQS: Ortho-P vs. TP (Aug/Sep) • TN WQS: evaluation of both single value max and annual ave. WQS (Aug/Sep) • Results of WQS model runs (Aug/Oct) • Technical Rationale for WQS revision (Oct/Jan)
Overview of Topics for Discussion • Comments on model calibration/confirmation • Proposed approach for WQS modeling • General approach • Flow regimes • Analysis and interpretation of model results • Preliminary results of WQS model runs
Summary of Focus Group Comments • General Comment: “Is this model being designed to predict future water quality issues or what is it used for? I don’t understand.” • Currently used to assess alternate water quality standards • Additional Feedback?
Overview of General Approach for WQS Modeling Development of Technical Rationale
Use of Models for WQS Review • Provide linkage between nutrient concentrations in the Truckee River and resulting dissolved oxygen levels • Account for other factors (flow, temperature, light, organic matter, aeration) • Understand river water quality response (dissolved oxygen) to ranges of nutrient concentrations under range of flow conditions • Establish site-specific nutrient criteria Sunlight Temperature Flow Dissolved Oxygen Aeration Nutrients (N&P) Organic Matter Algae
Shifting from Model Calibration to Application • Calibration/Confirmation • Generate confidence model is capable of accurately simulating historical river conditions • Model application • Predict water quality response under hypothetical scenarios (e.g., potential WQS levels)
Model Linkage: Model Calibration Meteorology, Land Use, TMWRF Effluent and Re-use Historical Reservoir Releases, Diversions WARMF Historical Diversions Tributary Flows, Nonpoint Sources TRHSPF In-stream Water Quality TMWRF Effluent Compare with observed data
Model Linkage: WQS Analysis Demands, Water Operations, In-stream Flow Targets Meteorology, Land Use, TMWRF Effluent and Re-use Reservoir Releases, Diversions WARMF TROM (flow management model) Diversions Tributary Flows, Nonpoint Sources TRHSPF In-stream Water Quality TMWRF Effluent Evaluate water quality response
Assumptions for Model Application • Flow management model provides model inputs reflective of historical climate/hydrology under selected river operations: • Reservoir releases • Diversions • TMWRF discharge flows • Climate – consistent with selected representative year • Land use / land cover – updated layer circa 2006
WQS Modeling Steps • Select flow management model • Establish representative flow period(s) • Construct / run a set of scenario runs • Link flow management model with WQ models • Vary N and P concentrations, examine DO response • Use visualization tools to view / report results
Flow Regimes Development of Technical Rationale
Why Flow Regime is Important • Truckee River water quality relates to flow • Managed flow conditions • Highly variable flow conditions year to year • WQS are set to protect Beneficial Uses throughout the expected range of flows (except during extreme low/high flows) • Low flow periods and low flow locations • Highest potential for algal growth and depressed DO in rivers • WQS don’t apply if flows are too low • NAC 445A.121(8) – “The specified standards are not considered violated when the natural conditions of the receiving water are outside the established limits, including periods of extreme high or low flows”
How is Low Flow Normally Set • Not defined in regulations • 7Q10 Statistics typically used • Low 7-day flows expected to occur once every 10 years • Drawbacks with highly regulated system such as Truckee • WQS Review • Can’t rely on historical flows; need to use “best professional judgment” to define alternative approach • Based on TROM simulations of 100 years of operations • NDEP recommends using two flow conditions for analysis • ~10th lowest year from the simulations • ~50th lowest (average) year from the simulations
Use of TROM Model Output to Select Low Flow Year • 100 years of predicted flows: 1901 - 2000 • TROM Scenarios: • Future No Action: 2033 TMWA Demand, Historic Operations, build out of M&I • Future TROA: 2033 TMWA Demand, TROA Operations • Current: 2002 TMWA Demand, Historic Operations
Assumptions for TROM Scenarios Future No Action (FNA) is most appropriate scenario
Selection of Representative Flow Conditions • NDEP developed a process for derivation of “target flows” based on TROM FNA output (NDEP Memorandum 12/28/2011) • Two representative flow regimes selected to date • Low Flow (10th percentile) • Average Flow (50th percentile)
Selection of 10th Percentile Flow Year: 1977 • 1977 better match than 1994 or 1988 • 1994 better match than 1988 or 1977 Conducted preliminary WQS simulations conducted for 1977, 1994, and 1988
Adjustment for 10th Percentile Year • Considered options for better representation of 10th percentile flow year • Choose single year most representative of critical flows above and below Derby Dam (e.g., 1977) • Use a hybrid of multiple years • e.g., upper river 1977, lower river 1994 • Develop a separate synthetic year that matches 10th percentile targets • Decided to keep 1977 FNA intact • Derived from the TROM FNA years closest to target flows • Retains link between flow regime and historical climate data • Only adjusted flows at Derby Dam for 1977 to bring closer to target values
1977 FNA Comparison of TROM, 10th percentile flows, and TRHSPF
Selection of 50th Percentile Year: 1985 • Investigated several candidate (recent) years based on TROM Future No Action (FNA) flows: 1973, 1985, 1987, 1993, 2000. • 50%-percentile reference flows (diamonds) generated NDEP method • Proceeded with using 1985 (FNA) – no additional adjustments
1985 FNA Comparison of TROM, 50th percentile flows, and TRHSPF
Analysis and Interpretation of Model Results Development of Technical Rationale
General Approach: Iterative TRHSPF WQS Simulations • Representative flow year (TROM output) • TRHSPF run iteratively with different concentrations of TN/TP/Ortho-P • Adjust N and P loads into river (increase or decrease) to match a range of annual average river concentrations • Concentrations vary temporally but hit target WQS on an annual average basis • Locations with adjustments: • East McCarran (upstream model boundary) • Segments with incoming loads (North Truckee Dr., Steamboat Cr., TMWRF) • Evaluate resulting attainment of DO WQS
Iterative Runs: Adjust Instream Concentrations = Specified WQS Derek to provide WinModel screendumps illustrating how a time series of concentration was adjusted to as part of an iterative run Target TN=0.75 mg/l, Reach 301 (E. McCarran) Blue = Baseline Green = WQS Run Increased load to meet a target concentration
Conceptual Plot of Model Results Relationship between Nutrient Concentrations and DO WQS Attainment % of time DO WQS is violated (Based on representative flow condition) ? Possible Nutrient WQS
Conceptual Plot of Model Results 10.0 Based on representative flow condition % of time DO WQS is violated 5.0 ? 0.0 0.04 0.05 0.06 Possible Nutrient WQS
Translate DO Concentrations to Compliance • Model simulates DO Concentrations for every hour at every model segment • Need to translate to compliance with DO WQS
DO Compliance Considerations • Highly dependent on the spatial and temporal scale upon which the DO exceedance percentages are calculated • Next steps: • Evaluate the results at different spatial and temporal scales • Make an educated determination as to what is appropriate
Options for Calculating Percent Violation of DO WQS % of Hours: attainment is aggregation of all hours that have violated WQS X hours violated 8760 hours/yr % of Days: if 1+ hours violate WQS on a given day, that day is not in attainment X days violated 365 days/yr Reviewing attainment as“% of days” is more conservative approach
Complexity of WQS Modeling Process • Models generate a lot of information • 38 simulations (19 for each flow regime) • 43 river segments, 8760 hours per year… • 14,313,840 dissolved oxygen modeled data points • Need to aggregate/distill model output for efficient decision making • Working Group has been testing and revising methodology for last two years
Considered Various Post-Processing Options • Spatial Aggregation • Coarse aggregation (Above Derby, Below Derby) • NDEP Control Point Reaches • Most critical reaches (individual segments) • Temporal Aggregation • Annual aggregation • Critical season: June-September • Critical month • Tested options with preliminary WQS simulations
Approach for Post-processing and Aggregation • Percent of days and percent of hours • Annual and critical season (June – Sep) • Four aggregated reaches and individual critical reaches • TN range evaluated at two phosphorus levels • Ortho-P at 0.05 mg/L (PLPT WQS) • Total P at 0.05 mg/L (current NDEP WQS) • Develop select additional plots/tables • Magnitude of violation
Next Steps • Finalization of model confirmation report • Focus Group comments and feedback (Sept 13th): • Technical approach • Finalization of WQS model runs/output interpretation • Development of Technical Rationale Report • Upcoming Focus Group Workshops (City of Fernley) • Sep 27, 2013 (F): 9 AM – 12 PM - modeling results • Oct 16, 2013 (W): 9 AM – 12 PM • Jan 15, 2014 (W): 9 AM – 12 PM • Additional Stakeholder / Focus Group meetings TBD in 2014