Download
1 / 18
190 likes | 460 Views
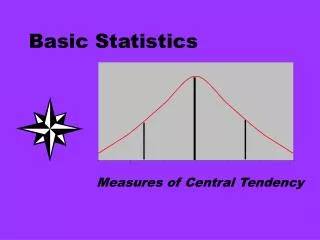
In the first biostatistics lecture, we talked about how to describe data. We summarized continuous data with means or medians, and categorical data with proportions. We also summarized variation with standard deviations or percentiles, and we noted that explaining variation is one key goal of clinical research.The next step is to analyze our data to start to understand variation. The first analyses will compare groups of people. Do they have different means? Medians? Proportions?Consider basel1146

E N D
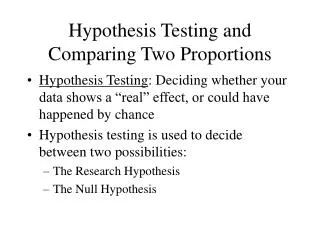
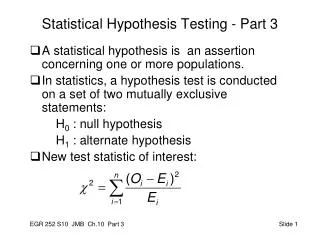
1. Biostatistics II: Basic Analytic Statistics (Hypothesis Testing) What is a null hypothesis?
How does a null hypothesis differ from your scientific hypothesis?
What are the P value and power of a test?
For common settings comparing means and proportions, what tests are usually best?
How should you report your findings?
6. Hypothesis testing outcomes