Download
1 / 31
310 likes | 601 Views
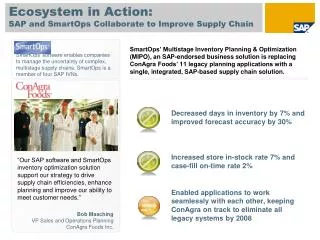
Using Benchmarking To Improve Supply Chain Processes. Dr. Robert A. Novack Dr. William L. Grenoble Center for Supply Chain Research Penn State University. AGENDA CSCR and Benchmarking Survey Methodology Demographics Benchmarking Practices Satisfaction With Benchmarking

E N D
Using Benchmarking To Improve Supply Chain Processes Dr. Robert A. Novack Dr. William L. Grenoble Center for Supply Chain Research Penn State University
AGENDA • CSCR and Benchmarking • Survey Methodology • Demographics • Benchmarking Practices • Satisfaction With Benchmarking • Issues and Observations
Survey Objectives • To Learn About How Organizations Practice Benchmarking: • Why Benchmark • What is Benchmarked? • How used? • Satisfaction • Challenges • To Provide Advice to Supply Chain Council
CSCR Focus Supply Chain
Consortium Benchmarking:Developing an Approach Start-Up On-Going Group Process GenericFormation Study Process Presentation Best Metrics Discussion Practices Survey
Methodology • Jointly sponsored research: • Penn State’s CSCR and the Supply Chain Council • Survey sent to 1,221 CLM executives • 126 useable responses • 10.3% response rate • 75 benchmarking firms (59.5%)
What are the reasons why your firm decided to benchmark SC processes?
Which of the Following SCOR Level One Metrics Is Your Organization Currently Measuring And/or Benchmarking? Measuring(%)Benchmarking (%) • Delivery performance 88.0 54.7 • Inventory days of supply 70.7 36.0 • Order fulfillment lead time 68.0 38.7 • Fill rate/ Perfect order fulfillment 62.7 37.3 • Supply chain management costs 58.7 37.3 • Supply chain response time 52.0 20.0
Which of the Following SCOR Level One Metrics Is Your Organization Currently Measuring And/or Benchmarking? Measuring(%)Benchmarking (%) • Cost of Goods Sold 49.3 14.7 • Asset Turns 42.7 18.7 • Cash-to-Cash cycle time 34.7 20.0 • Warranty cost or returns processing cost 24.0 6.7 • Value-added productivity 22.7 9.3 • Production flexibility 16.0 9.3
How Do You Use the Results of Benchmarking? • 90.7% To encourage improved performance • 82.7% To plan improvement in supply chain processes • 68.0% To reengineer business processes • 66.7% To gain a competitive advantage in the industry
72.0% Transportation 62.7% Fulfillment 88.0% Delivery Performance 68.0% Lead Time 62.7% Fill Rate Process Measured Functional Benchmarked Area
58.7% Supply Chain Cost 5.25 Reduced Operating Costs Benchmarking to Achieve Results Process Measured
90.7% Improved Performance 82.7% Plan Process Improvement 5.42 Performance Comparisons 5.52 Improved Process Benchmarking Value Use of Benchmarking Results
How Would You Assess the Satisfaction With Your Overall Benchmarking Efforts?
How Would You Assess the Satisfaction With Your Overall Benchmarking Efforts?
How Satisfied Are You With the Following Attributes Concerning Your Current Benchmarking Efforts? AttributeScore* • Quality of output 4.76 • Comparability 4.50 • Timeliness 4.51 • Price/ Cost 4.53 * 7 point Likert-type scale; 1= not satisfied, 7= satisfied
How Important Have the Following Outputs or Benefits of Benchmarking Been in Providing Value to Your Firm?
Please Indicate How Important Benchmarking Initiatives Have Been to Your Firm in Achieving Improved Results in the Following Areas?
The Most Important Challenges to Overcome to Be Successful in Benchmarking
What general advice would you offer to SCC for future member benchmarking?
Overall Rankings of Key Processes ProcessMeasuredBenchmarked Service 1 1 Cost 2 2 Financials 3 2 Responsiveness 4 4
Overall Rankings of Benchmarking Impacts on Achieving Improved Results ProcessRank Service 1 Cost 2 Revenue 3
KEY TAKE AWAYS • Benchmarking is an important component of supply chain improvement initiatives, but is still not practiced by many firms. • Most firms approach benchmarking as a narrow, not broad, effort. • Satisfaction with current efforts is lukewarm. • Benchmarking is not easy!