Download
1 / 42
480 likes | 679 Views
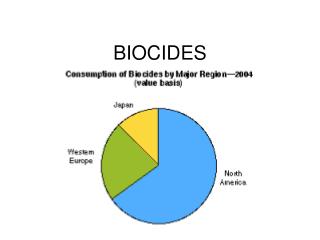
Emission scenario document for biocides used as rodenticides Jørgen Larsen. PT 8 & PT 14 Exposure Scenario Course 9-10 October 2003, Ispra. This presentation. General issues and background Basic use and exposure scenarios of the environment Exposure scenarios for primary poisoning

E N D
Emission scenario document for biocides used as rodenticidesJørgen Larsen PT 8 & PT 14 Exposure Scenario Course 9-10 October 2003, Ispra
This presentation • General issues and background • Basic use and exposure scenarios of the environment • Exposure scenarios for primary poisoning • Exposure scenarios for secondary poisoning • Conclusions
Production Formulation professional use Private use In product Processing Processing In product Service life Waste treatment Primary and secondary poisoning Life-cycle of rodenticides
PT 14 Rodenticides • Used for controlling rodents • Rats • Mice • Voles • Basic use scenarios • Sewer systems • Buildings (inside and around) • Open fields • Waste dumps
Sewer systems: Assumptions • Realistic worst-case: 21 days campaign • Day 0: 300 wax blocks • Day 7: 100 wax blocks replenished • Day 14: 50 wax blocks replenished • Maximum emission during 1st week: 100 blocks • Weight of wax block: 0.3 kg • Fraction of a.i. (substance) released: 0.9 • Standard STP scenario (TGD) • 200 L/day, 10,000 inhabitants
Substance A: Anti-coagulant (0.005% a.i.) Elocalwater: 0.2 g a.i./day Cinfluent: 0.1 μg a.i./L Substance B: Coagulant (4% a.i.) Elocalwater: 150 g a.i./day Cinfluent: 77 μg a.i./L Sewer systems: Results
Sewer systems: Results • Result depends on • Used amount of product (Qprod) • Fraction of a.i. in product (Fcproduct) • Fraction of release (Freleased) • Estimation of PEClocal • Fate (degradation, sorption, volatilisation) in STP (presence of STP is default for local scenario) • Dilution in aquatic environment PEClocalwater • Disposal of sludge on farmland PEClocalsoil
In and around buildings Assumptions on bait stations • Realistic worst-case: 21 days campaign • Bait stations: 10 • No. of replenishments: 5 • Weight of wax block: 0.25 kg • Fraction released due to spillage: 0.01 • Spillage area: 0.09 m2 (0.1 m around station) • Fraction ingested: 0.99 • Fraction released of ingested: 0.9 • Frequented area: 550 m2 (10 m around building)
Substance A: Anti-coagulant (0.005% a.i.) Elocal-D: 0.006 g a.i. Clocal-D: 0.04 mg a.i./kg Elocal-ID: 0.56 g a.i. Clocal-ID: 0.006 mg a.i./kg Clocal-D+ID: 0.047 mg/kg Substance B: Coagulant (4% a.i.) Elocal-D: 5 g a.i. Clocal-D: 33 mg a.i./kg Elocal-ID: 446 g a.i. Clocal-ID: 4.8 mg a.i./kg Clocal-D+ID: 37 mg/kg Buildings: Results re. bait stations
Open areas: Assumptionsre. pellets and impregnated grain • Pellets or impregnated grain used in rat burrow • Entrance holes are sealed after application • Product used: 0.1 kg • Soil volume: 0.0085 m3 (lower half of 0.3 m burrow, 0.1 m from the wall) • Fraction released during application: 0.05 • Fraction released during use: 0.2 • Refills: 2
Substance A: Anti-coagulant (0.005% a.i.) Elocal-D: 0.0025 g a.i. Clocal-D: 0.17 mg a.i./kg Substance B: Coagulant (4% a.i.) Elocal-D: 2 g a.i. Clocal-D: 138 mg a.i./kg Open areas: Results, pellets in rat burrow
Open areas: Assumptionsre. contact powder • Contact powder often used when plenty of food is available • Contact powder applied directly in burrow by spoon or dust-blower • Soil volume: 0.0085 m3 • Fraction released to soil: 0.9 • Product used: 0.1 kg (example)
Substance A: Anti-coagulant (0.005% a.i.) Elocal-D: 0.0045 g a.i. Clocal-D: 0.3 mg a.i./kg Substance B: Coagulant (4% a.i.) Elocal-D: 3.6 g a.i. Clocal-D: 250 mg a.i./kg Open areas: Results, contact powder
Primary poisoning: Estimated Daily Intake FIR: Food intake rate of indicator species (gram fresh weight per day) BW: Body weight (g) C: Concentration of compound in fresh diet (mg/kg) AV: Avoidance factor (0 to 1) PT: Fraction of diet obtained in treated area (0 to 1) PD: Fraction of food type in diet (0 to 1)
For all birds: log DFI = 0.651 x log BW - 0.188 For songbirds: log DFI = 0.85 x log BW - 0.4 For other birds: log DFI = 0.751 x log BW - 0.521 For mammals: log DFI = 0.822 x log BW - 0.629 Regression equations to predict dry weight intake for an animal (Nagy, 1987)
Daily food intake of the indicator species FIR: Food intake rate of indicator species (gram fresh weight per day) DEE: Daily Energy Expenditure of the indicator species (kJ per day) FE: Food Energy (kJ per dry gram) MC: Moisture Content (%) AE: Assimilation Efficiency (%) From Crocker et al. 2002
Comparison of daily food intake based on different calculation methods
Comparison of daily food intake based on different calculation methods
Comparison of daily food intake based on different calculation methods
Estimated Daily Intake of a.i. in a small cereal seeds eating bird (b.w. 15 g)* Estimated daily intake of a.i.: 19.3 mg kg bw/d Food intake rate: 5.8 g/day Body weight: 15 g. Concentration of a.i. in fresh diet : 50 mg/kg Avoidance factor: 1 Fraction of diet obtained in treated area: 1 Fraction of food type in diet: 1 * Realistic worst case; based on calculations from Crocker et al.2002
Estimated Daily Intake of a.i. in a small cereal seeds eating mammal (b.w. 25 g)* Estimated daily intake of a.i.: 11.4 mg kg bw/d Food intake rate: 5.7 g/day Body weight: 25 g. Concentration of a.i. in fresh diet : 50 mg/kg Avoidance factor: 1 Fraction of diet obtained in treated area: 1 Fraction of food type in diet: 1 * Realistic worst case; based on calculation from Crocker et al. 2002
Uncertainty of the estimated food intake Preliminary probabilistic analysis indicated that the upper 95 percentile for the estimate averaged about twice the mean estimate.This result is preliminary, but indicates the potential range of uncertainty. If the user wished to be precautionary in their assessment, multiplying the estimated food intake by a factor of two might be a reasonable precaution against underestimating food intake.
Expected concentration of a.i. in the animal after elimination
Refinement steps in the evaluation of the potential for primary poisoning As rodenticides inevitably are toxic to non-target species an exposure assessment that is based on exclusive feeding on the bait will always come to the conclusion of potential risk. Two refinement steps are obvious: • Consider accessibility of baits: • Accessibility might be reduced by requiring appropriate use instructions to be put on the label • Consider attractivity: • The bait could be unattractive to e.g. birds to a certain degree due to colour, consistency and other factors.
Secondary poisoning • Calculation of rodenticide in target animal on Day 1 immediately after first meal • The food intake rate divided with body weight is as default set to 10% i.e. FIR/BW = 0.1 • illustrating realistic worst case (AV, PT, and PD = 1) • The concentration of a.i. in the bait C = 50 mg/kg
Secondary poisoning • The estimated residue concentration in target rodent on Day 2 before meal: • EC2 = 5 x (1- 0.3) = 3.5 mg/kg • Day 5 after the last meal = 13.9 mg/kg • Day 6 * = 9.7 mg/kg • Day 7 (mean time to death) = 6.8 mg/kg * The feeding period has been set to a default value of 5 days until the onset of symptoms after which it eats nothing until its death
Secondary poisoning • For short term exposure the fraction of poisoned rodents in predator´s diet is assumed to be 1. • For long term exposure the fraction of poisoned rodents in predator´s diet is assumed to be 0.5.
Secondary poisoning • Predators (mammals or birds) feeding on poisoned rodents • Oral exposure (PECoral,predator) depends on • ECn: Estimated Concentration in rodent on day n • ETE: Estimated daily uptake on day n • Frodent: Fraction of poisoned rodent in diet of predator • ECn depends on fraction bait consumption
Secondary poisoning: Estimated Concentration in poisoned rodent
Refinement steps in the evaluation of the potential for secondary poisoning If a risk is indicated the following options for refinement are promising: • Evaluate secondary poisoning studies which are already available for current rodenticides • Improve estimate of proportion of target rodent in the diet of predators; suitable information might already be available from literature on feeding ecology; otherwise data could be generated using a marker in the bait • Field studies, monitoring
Conclusions PT 14 Rodenticides • Emission Scenario Document has been prepared (Danish EPA, EUBEES 2) • ESD covers use scenarios and environmental compartments of (presumed) highest concern • ESD based on empirical data & default values • ESD has not been validated in practice • ESD can be used when no other data are available • Applicants should, whenever possible, use specific data on use pattern and emission rate
Conclusions PT 14 Rodenticides • Emission Scenario Document has been prepared (Danish EPA, EUBEES 2) • ESD covers use scenarios and environmental compartments of (presumed) highest concern • ESD based on empirical data & default values • ESD has not been validated in practice • ESD can be used when no other data are available • Applicants should, whenever possible, use specific data on use pattern and emission rate