Download
1 / 4
40 likes | 61 Views
Addend Analytics is a Microsoft Power BI-partner based in Mumbai, India. Apart from being authorized for Power BI implementations, Addend has successfully executed Power BI projects for 100 clients across sectors like Financial Services, Banking, Insurance, Retail, Sales, Manufacturing, Real estate, Logistics, and Healthcare in countries like the US, Europe, Switzerland, and Australia. Get a free consultation now by emailing us at kamal.sharma@addendanalytics.com

E N D
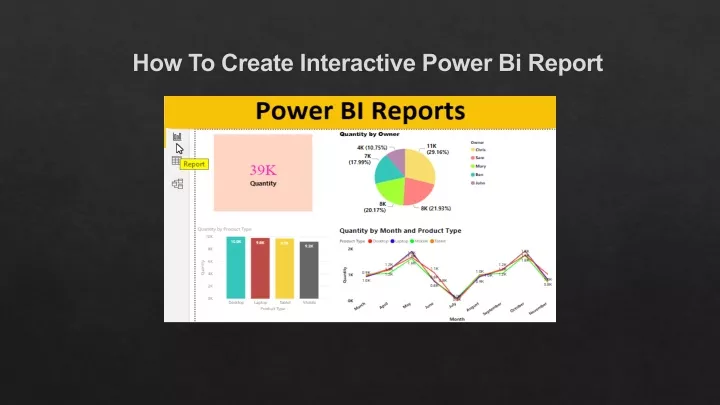
Creating a Best Power Bi Reports is more like creating an excel sheet. Microsoft has attempted to provide an easy-to-understand overview of everyone who uses the product. You can be from any genre, and your needs can range from record analysis to big data analysis; however, Power BI has a solution for everyone. Furthermore, with the right Power BI training, you can create master-level reports in a matter of minutes. • In this post, we'll start from the very beginning and walk you through the process of power bi integrations. You can also discover the best practises for containing activities before creating your first report for better reports. • Gathering information is the first stage in creating a report. You can import data in a variety of ways, but for this model, we'll start with an excel sheet. To import your sheet, go to the top of the page and choose "Get Data," then "Excel." • Navigate to the Data view next, where you may make all of your information's edits and corrections. You may surely pick and choose components, as well as erase those that aren't required. • Once you are finished with the progressions and planning, you can publish the report to the Power BI site from where you can undoubtedly share it with anybody.
Create and Check Power Reports on Mobile • From the mobile app, Microsoft provides all of the data investigation highlights of Power Bi Interactive Dashboard. From your mobile application, you can quickly monitor and control anything in your reports. • Let's look at how you may use your mobile app to examine a comparable report you recently prepared. Any report can be viewed and accessed by scanning a QR code. Even if you only have viewing privileges to a report, you can generate QR codes for it. • This QR code can be moved on any device and platform and would then be able to be utilized for access. • Click on the ellipsis button on the upper right corner of your Power BI site. • Among the choices that you see, click on Generate QR code. • Click on the download option to save the code. • You would now be able to utilize this QR code to share it with anybody. Anybody with this code will have the option to get to the report directly from the mobile application.
Addend Analytics is a Microsoft Power BI-partner based in Mumbai, India. Apart from being authorized for Power BI implementations, Addend has successfully executed Power BI projects for 100+ clients across sectors like Financial Services, Banking, Insurance, Retail, Sales, Manufacturing, Real estate, Logistics, and Healthcare in countries like the US, Europe, Switzerland, and Australia. Get a free consultation now by emailing us at kamal.sharma@addendanalytics.com