Download
1 / 40
430 likes | 703 Views
Life expectancy. Jean-François Boivin 8 October 2010. Life expectancy. All ages 7.5 6.7. Source: Statistics Canada, Vital Statistics compendium, 1996. How can we summarize in one number a series of age-specific mortality rates?.

E N D
Life expectancy Jean-François Boivin 8 October 2010
Life expectancy All ages 7.5 6.7 Source: Statistics Canada, Vital Statistics compendium, 1996 How can we summarize in one number a series of age-specific mortality rates?
A period of lifetable gives an overview of the present mortality experience of a population and shows projections of future mortality experience. The term life expectancy refers to the number of years that a person is expected to live, at any particular year. With respect to a year of interest (e.g. 2000), a period life table enables us to project the future life expectancy of persons born during the year as well as the remaining life expectancy of persons who have attained a certain age. Friis and Sellers, 4th edition, page 290.
x = All ages: Total person years = 7,686,810
There are additional ways to describe the mortality experience of the population. One measure, which takes into account the effect of premature death caused by diseases, is known as years of potential life lost (YPLL). For example, we might assume that the average person lives until age 65. If an individual succumbs at age 60, that person has lost five years of life. PLL is computed by summing years of life lost for each individual in a population such as the United States for a specific cause of mortality. Friis and Sellers, page 290.
Another measure is disability-adjusted life years (DALYs), which adds the time a person has a disability to the time lost to early death. Thus, one DALY indicates one year of life lost to the combination of disability and early mortality. Friis and Sellers.
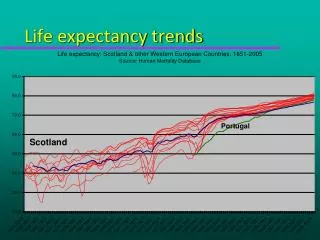
tuberculosis Tubercle bacillus identified Chemotherapy BCG vaccination Source: McKeown, 1976. Reproduced by kind permission of the publisher. Beaglehole et al. 1993
The epidemiologic transition A theory of the epidemiology of population change Omran AR. Milbank Memorial Fund Quaterly 1971; 49: 509-538
This theory provides a … description and explanation … of the “demographic transition", the spectacular decline firstly of death rates and then of birth rates which has been observed in all currently industrialised countries.” Journal of Epidemiology and Community Health 1994; 48: 329-332
In the epidemiological transition theory, the historical development of mortality over time is characterised by three phases: the "age of pestilence and famine", the "age of receding pandemics"; and the "age of degenerative and man-made diseases". It is the transition from a cause of death pattern dominated by infectious diseases with very high mortality, especially at younger ages, to a pattern dominated by chronic diseases and injuries with lower mortality, mostly peaking at older ages, that is seen to be responsible for the tremendous increase in life expectancy. Journal of Epidemiology and Community Health 1994; 48: 329-33
In countries in western Europe and northern America the shift started early and took approximately 100 years. This was called the "western" or "classical model" of the epidemiologic transition. In a number of other countries, notably Japan and eastern Europe, the transition started later but proceeded much more quickly (the so called "accelerated model"). Finally, in many third world countries the transition started even later and, unlike that in currently industrialised countries, has not yet been completed (the "delayed" or "contemporary model"). Journal of Epidemiology and Community Health 1994; 48: 329-33
“Omran attributed the decline of mortality to a complex of factors closely linked to "modernisation". For the western model, socioeconomic progress, leading to a rise in living standards, was presumed to be a very important contributing factor, whereas for the accelerated and delayed models, public health and medical technologies were considered relatively more important.” Journal of Epidemiology and Community Health 1994; 48: 329-332
Leading factors determining the epidemiologic transition: • Public health • Medicine • Wealth and income • Nutrition • Behaviour • Education Riley (2001), p 56
Public health • suppression of waterborne disease • study of disease problems of poverty • disease surveillance and control • mass vaccination • insect control • purposeful application of medical, social, and scientific knowledge to the control of hazard, • etc. Riley, page 77
The shift from acute infectious and deficiency diseases to chronic noncommunicable diseases is not a simple transition but a complex and dynamic epidemiological process, with some diseases disappearing and others appearing or reemerging. The unabated pandemic of childhood and adulthood obesity and concomitant comorbidities are affecting both rich and poor nations, while infectious diseases remain an important public health problem, particularly in developing countries.
Emerging and Reemerging Disease A recent review (3) suggested that 175 human pathogens (12% of those known) were emerging or reemerging and that 37 pathogens have been recognized since 1973, including rotavirus, Ebola virus, HIV-1 and HIV-2, and most recently, Nipah virus. Among the infectious vectorborne diseases, dengue, dengue hemorrhagic fever, yellow fever, plague, malaria, leishmaniasis, rodent-borne viruses, and arboviruses are persisting, and sometimes reemerging, with serious threats to human health. For example, malaria, which is the foremost vector-borne disease worldwide, continues to worsen in many areas, and there are now an estimated 300 million to 500 million cases of malaria worldwide each year with 2 million to 4 million deaths.
Improving the health status of poor populations requires a twin approach. Not only are infectious diseases still common, but chronic diseases, including tobacco-related diseases, are on the rise.