Download
1 / 72
720 likes | 875 Views
Nuclear Power – Why now?. Martin Sevior, School of Physics, University of Melbourne. http://nuclearinfo.net. Ivona Okuniewicz Alaster Meehan Gareth Jones Damien George Adrian Flitney Greg Filewood Technical Support Lyle Winton Reviewed by: Dr. Andrew Martin Web Design

E N D
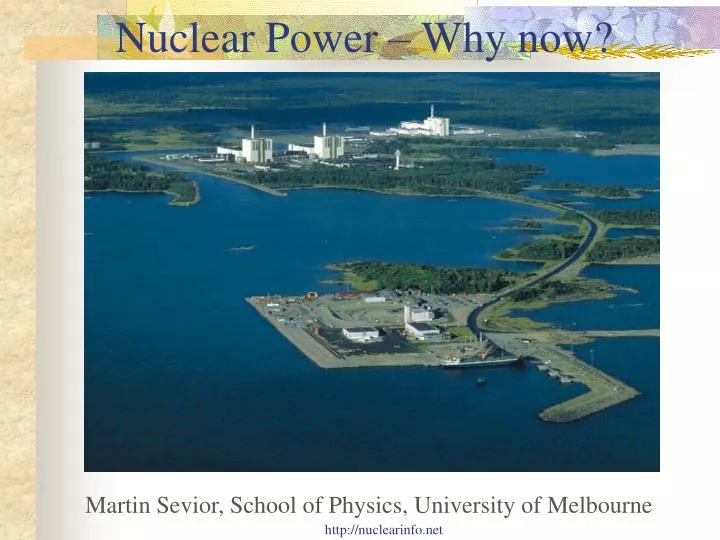
Nuclear Power – Why now? Martin Sevior, School of Physics, University of Melbourne http://nuclearinfo.net
http://nuclearinfo.net • Ivona Okuniewicz • Alaster Meehan • Gareth Jones • Damien George • Adrian Flitney • Greg Filewood Technical Support • Lyle Winton Reviewed by: • Dr. Andrew Martin Web Design • University of Melbourne Writing Center http://nuclearinfo.net
Energy and Entropy • 2nd Law of Thermodynamics • Entropy tends to increase • Sharing of energy amongst all possible states • Life is in a very low state of entropy • To exist it must create large amounts of entropy elsewhere. (S = Q/T) • Life requires large amounts of Energy. http://nuclearinfo.net
Life and energy • Life takes energy from the sun Life represents a ~0.02% decrease in entropy from the sun heating earth http://nuclearinfo.net
Energy and civilization • Our Civilization is based on cheap energy and machines • Previous civilizations utilized humans and animals. (Still the case for large parts of the world.) • Given sufficient quantities of energy our civilization can generate all the products it needs. (Food, Health, Metals, Plastics, Water) http://nuclearinfo.net
Energy in Australia • Australia’s Electricity needs are currently supplied by 40 GigaWatts of power stations. • Our electricity demand is forecast to grow by over 2% per year to 2020 • On average 1.0 GigaWatts increase each year • Equivalent to Loy-Yang B Power Station http://nuclearinfo.net
Energy in the World • China (pop 1.4 Billion) growing at 10% per year. • India (pop 1 Billion) growing at 6% per year. • Both aspire to Western standards of living • China likely to achieve current Australian standard in 2040’s • Effect will be to triple world energy consumption. • Only a large scale trade embargo will prevent them from effectively competing with the west. http://nuclearinfo.net
World Energy Growth. Energy Growth by “region” Energy Growth by source Projections are “business as usual” Source: U.S. Energy Information Administration. http://nuclearinfo.net
How long can we keep using Oil? • The rate of Oil usage is substantially greater than the rate of new Oil discoveries • Developing Nations have become competitors for Oil Simple extrapolation shows Oil exhausted by 2036 http://nuclearinfo.net
Is Oil coming up against a wall? • Australia’s Oil production peaked in 2000 • Will/When will World Oil production peak? (http://sydneypeakoil.com/phpBB/viewtopic.php?t=1972) http://nuclearinfo.net
Global Climate Change • The Earth’s atmosphere acts as a “Greenhouse”. Traps heat that would otherwise be radiated to space. • Carbon Dioxide (CO2) is the 2nd largest contributor (and biggest driver) • Carbon Dioxide is also the fundamental byproduct of Fossil Fuel consumption • Large scale use of Fossil Fuels has substantially increased CO2 concentration http://nuclearinfo.net
CO2 increase in the Atmosphere http://nuclearinfo.net
Global Climate Change Predicted world temperature changes Past world temperature changes The different curves are different predictions based on different physical assumptions and future CO2 emissions The current CO2 concentration is unprecedented over half a million years http://nuclearinfo.net
Global Temperature Measurements http://nuclearinfo.net
Myths about Climate Change • Myth- Water vapour is the main source of Greenhouse heating so CO2 makes no difference. • Residency time of water is 10 days, CO2 is ~100 years. CO2 is the driver, water vapour provides feedback/amplification. • Myth - CO2 absorption lines are saturated. • Only true at ground level. The upper atmosphere is sensitive to CO2 concentration • Net effect of doubling CO2 is an additional 4 watts/m2 extra heat. • No climate model shows a decrease in temperature with an increase in CO2 http://nuclearinfo.net
Predictions for CO2 outputs The developing world will likely produce more CO2 emissions than the West before 2020 Only a large scale trade embargo on China and India and the rest of the developing world will prevent competition and growth http://nuclearinfo.net
Greenhouse Emission targets • Kyoto protocol • Reduce Greenhouse emissions by 5.2% from 1990 levels by 2008-2012 • This is extremely hard. eg Canada has increased it’s emissions by 20% since 1990 • Future • Reduce greenhouse emissions by 60% from 1990 levels by 2050 to stabilize temperature rise to 2 C • Can we get away with “cheating”? • What if USA adopts Kyoto? http://nuclearinfo.net
Australian CO2 emissions Around 50% of Australia’s CO2 emissions are from electricity production. http://nuclearinfo.net
Total World CO2 emissions • Total world demand for energy is expected to at least double by 2050 • Much is this growth is in the third world which needs energy to escape poverty • The default solution to supply this energy is to burn more fossil fuels • Achieving world 60% reduction in CO2 emissions will be impossible if this happens http://nuclearinfo.net
The transition. • Having access to large amounts of cheap energy is vital for our civilization. • Over the next human generation we will need to manage a transition from our Fossil-Fuel based energy sources • The combination of resource depletion and Climate Change mitigation forces this. • Getting this right is vital for the world we leave our children. • I believe that this is one of the great issues facing this generation. http://nuclearinfo.net
Nuclear Energy • About 6 Billion years ago a supernova exploded in this region of space. • About 1 solar mass of hydrogen was converted to Helium in about 1 second • All the elements heavier than Lithium were created making life possible in the solar system • A tiny fraction of the energy was used to create heavy elements like Uranium and Thorium. http://nuclearinfo.net
Nuclear Energy • Chemical reactions release a few electron-volts of energy per reaction. Nuclear Fission releases 200 Million electron volts per reaction A neutron is captured by 233U,235U or 239Pu. The nucleus breaks apart and releases 2-3 more neutrons. These in turn can induce further fissions. http://nuclearinfo.net
Nuclear energy • The energy release from a single fission reaction is about one-tenth that of an anti-matter annihilation. • There is as much energy in one gram of Uranium as 3 tonnes of coal. • The reaction produces no CO2 • So how much Uranium is present on Earth? http://nuclearinfo.net
Uranium Abundance. • The Earth’s crust is estimated to contain 40 trillion tonnes of Uranium and 3 times as much Thorium. • We have mined less than a ten millionth of this. (We have extracted about half of all conventional Oil) • If burnt in a “4th Generation” reactor provides 6 Billion years of energy. • If burned in a current reactor enough for 24 Million years. • But most is inaccessible. How much is really available? • Look at Energy cost of mining compared to energy Generated in Reactors http://nuclearinfo.net
Uranium Abundance Proven reserves as of June 2006 amount to 4.7 Million tonnes, sufficient for 85 years at present consumption rates Rossing mine in Namibia has a Uranium abundance of 350 ppm and provides an energy gain of 500 Extrapolating to 10 ppm provides an energy gain of 14 4th Generation reactor (50 times more efficient Uranium usage) provides an energy gain of 100 at 2 ppm At least 8,000 times more Uranium can be usefully mined using current reactors. 32,000 times more with 4th Generation. (96 million years worth.) http://nuclearinfo.net
Uranium in Sea Water • Very low concentration 3 mg/m^3, but a huge resource ~ 4.5x10⁹ tonnes • Japanese experiment recovered > 1 Kg in 240 day exposure http://nuclearinfo.net
Nuclear Power • Nuclear Power has been demonstrated to work at large scale. • France (80% Nuke, 20% Hydro) and Sweden (50% Nuke, 50% Hydro) have the lowest per capita greenhouse emissions of large countries in the OECD • Australia, with it’s reliance on Coal-powered electricity, has the highest http://nuclearinfo.net
Nuclear Greenhouse Gas emissions The Nuclear Fuel cycle is complex. How much Greenhouse Gases are produced? http://nuclearinfo.net
Vattenfall • The Swedish Energy utility operates Nuclear, Hydro, Wind, BioMass, Solar and Fossil Fuel facilities. • Vattenfall have performed LifeCycle Analyses for these. • These are described in Environment Product Descriptions “EPD”. • Useful “Worlds Best Practice” reference http://nuclearinfo.net
CO2 emissions from Nuclear Vattenfall EPD calculations, Gas 400 gm/kw-hr, Coal 700 – 1000 gm/kw-hr http://nuclearinfo.net
Vattenfall CO2 emissions from other sources http://nuclearinfo.net
CO2 Emissions from Wind Power • Need ~6,000 2 MW Wind Turbines to match 1 Nuclear Plant (60 year lifetime) • Requires 8-14 times as much steel and concrete http://nuclearinfo.net
Storm and Smith Theory • They conclude that Uranium cannot be mined at Ore concentrations below 0.01% U by mass • This implies energy cost at 0.01% of mining = energy gain of reactor • Rossing Mine in Nambia. Ore 0.035%. 3000 tonnes mined per year. Enough for 15 GW-Years. • Storm and Smith predict energy cost = 60 PJ • Measured energy cost of Rossing = 1 PJ • Namibia uses 55 PJ per year (2003) • Cost of 60 PJ ~ $1.7 Billion (diesel) • Value of Uranium at $100/kg = $300 Million • Similar for Olympic Dam, Ranger and all operating low Grade mines • Storm and Smith are WRONG. http://nuclearinfo.net
Nuclear Reactors • Nuclear reactors work by purposely allowing a controlled chain reaction. • This is controlled by adjusting the neutron multiplication factor. • Current nuclear technology mostly employs “Light Water Reactors” which burn Uranium enriched in 235U from it’s natural 0.7% to around 3% • The reactor is shutdown and fuel is changed after the 235U abundance has fallen to around 1.2% • This typically occurs every 2 years. • So every 2 years 60 tonnes of fuel is replaced • Compare to Coal fired plants which burn 3000 tonnes of fuel every day. http://nuclearinfo.net
Science of Nuclear Power • Cross sections for fission http://nuclearinfo.net
Thermal Nuclear Reactors • Neutron cycle in 235U and 238U mixture Self-sustaining chain reaction. Requires neutron multiplication factor k =1.00000 http://nuclearinfo.net
Control of Thermal Reactors • Controlled via absorption in 238U At least 20 times more 238U than 235U • At higher temps • Doppler broaden • Harder spectrum • Increases 238U absorption http://nuclearinfo.net
Control of light water reactors • Delayed neutron emission • 0.7% neutrons emitted after beta decay (8 seconds) • Negative temperature coefficient • (k reduces with T) • Negative “void” coefficient. • Loss of coolant through bubble formation or other means, means no further moderation and a decrease in reactivity. • “Massive loss of coolant” • Decay heat problem • Second generation reactors have multiple active backup and containment. http://nuclearinfo.net
Radiation • Nuclear Energy produces vast amounts of radioactivity which is extremely dangerous. Effects of Radiation: • Cell Death or Apoptosis • Cancer Induction (0.06/Sv) • Genetic Damage to Future Generations (0.02/Sv) However we are all exposed to radiation every day of lives. It cannot be avoided. http://nuclearinfo.net
Radiation Exposure Typical background exposure is 3000 micro-seiverts per year http://nuclearinfo.net
Nuclear Safety • Typical large Nuclear Power Plant contains 10 billion Giga-Becquerel's of activity. • 1 Giga-Becquerel typically leads to an unwanted exposure. • Nuclear Power Plants contain vast amounts of dangerous material. • Safely handling this is a significant challenge. http://nuclearinfo.net
Safety – Reactivity Control • Nuclear reactors work by keeping the neutron multiplication factor to be 1 • Multiplication factor is adjusted by changing the configuration of neutron absorbers. • This possible because 0.6% of neutron emission is delayed by a few seconds • Light water reactors naturally slow down when the temperature increases – “negative temperature coefficient” • Light water reactors naturally slow down if there is a loss of coolant – “negative void coefficient” http://nuclearinfo.net
Safety – Reactivity Control Accidents: Numerous things can (and do) go wrong during operations. These are normally handled through routine adjustments of the reactor parameters Worst case is massive loss of primary coolant. Current reactor handle this with multiple redundant systems to pump water through the core. “Active Safety systems” Next generation reactors employ Passive features which rely on Laws of Physics to ensure safe shutdown. http://nuclearinfo.net
Safety • The U.S. Nuclear Regulatory Commission (NRC) requires reactors to be design so that “Core damage accidents” occur less than 1 in 10,000 years of reactor operation. • In this case the radiation is contained within a safety shell. (50 cm reinforced steel surrounded by 1.3 meters of concrete.) • Current Reactors are estimated to have core failure rates of 1 in 100,000 years of operation. • New reactors under investigation for deployment are estimated to have failure rates of 1 in 2 million years of operation. http://nuclearinfo.net
Safety • The western nuclear power industry has the best safety record of any large scale industrial activity. • Within the US, communities living close Nuclear Power plants are overwhelmingly in favour of continued operation. • There is strong competition between communities to be the location of New Reactors. • As of February 2006, the NRC had received “expressions of interest” for 17 new Nuclear Power Plants in the USA. All have local support. http://nuclearinfo.net
Safety - Chernobyl • The Chernobyl reactor had a number terrible deficiencies compared to Western reactors. • No containment structure • “Positive void coefficient” at low power. • “Control rods” were graphite tipped! • As part of an experiment, operators switched off the safety interlocks • Reduced the Power of reactor to low level. • Strenuously tried to increase the power in an unconventional operating environment. • Fundamental Failure of “Safety Culture”. http://nuclearinfo.net
Nuclear Power Costs • Total cost = Cost of Capital + Operating Costs • Operating costs of current plants are the lowest of all forms except Hydro (typically 1.5 cents/KwHr). • New Nuclear plants are projected to cost less than 1.5 US Billion dollars and operate for 60 years. • BUT best new plants have First of their Kind risks • Projected Electricity costs are 2.2-3.8 US cents/KW-Hr (but up to 6 US cents/KW-Hr) • Current Australian Eastern Australian coal electricity costs around 2.2 - 4 US cents/KW-Hr • “Clean Coal” expected to add 2 cents/Kw-Hr http://nuclearinfo.net
Previous generation Nuclear Power • In the USA Nuclear Power plants turned out to be FAR more expensive. • Plant cost was 3 – 5 Billion for 1 GW • Operational availability was around 60% • Design deficiencies – NRC mandated changes • Two stage licensing • Fragmented industry for construction • Fragmented industry during operation http://nuclearinfo.net
Current US experience • Availability has increased to more than 90% • Specialist companies now operate the US fleet. • Costs average 1.6 cents/KW-Hr • Nuclear Industry expects new plants cost 1.0 – 2.0 Billion per GW • 2.3- 5 US cents/KW -Hr http://nuclearinfo.net
Nuclear Waste • Nuclear Power plants produce 30 tonnes of high level waste/year. • 95% of the energy in the fuel remains • Waste consists of short-lived light fission products and long-lived trans-Uranics. • Current waste handling procedure is to leave spent fuel in cooling ponds for 20 years. Followed by either dry storage, reprocessing or long term geologic disposal http://nuclearinfo.net