Download

1 / 22

E N D
LEARNING GOALS In this module we will learn • What are Data Flow Diagrams (DFDs)? • Why they are useful? • How are they developed? • How to level DFDs? • Good style conventions in developing DFDs • Difference between Logical and Physical DFDs
WHY DFD ? Provides an overview of- • What data a system processes? • What transformations are performed? • What data are stored? • What results are produced and where they flow ?
WHY DFD ? Graphical nature makes it a good communication tool between- • User and analyst • Analyst and System designer Structure of DFD allows starting from a broad overview and expand it to a hierarchy of detailed diagrams
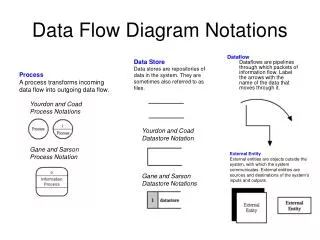
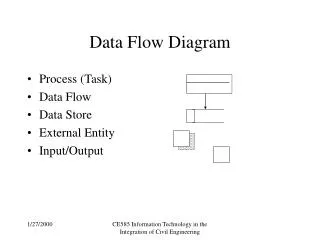
WHAT ARE DATA FLOW DIAGRAMS? DFDs models the system by depicting • External entities from which the data flows and where results terminate • Processes which transform data flows • Data stores from which the data are read or into which data are written by the processes.
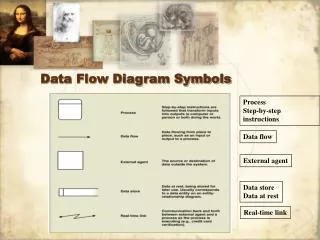
SYMBOLS USED IN DFD PROCESS • A circle represents a process • Straight lines with incoming arrows are input data flows • Straight lines with outgoing arrows are output data flows • Processes are given serial numbers for easy reference • Labels are assigned to Data flow. These aid documentation
SYMBOLS USED IN DFD EXTERNAL ENTITIES • A Rectangle represents an external entity • They either supply data or receive data • They do not process data
SYMBOLS USED IN DFD DATA STORES • A Data Store is a repository of data • Data can be written into the data store. This is depicted by an outgoing arrow • Data can be read from a data store. This is depicted by an incoming arrow • External entity cannot read or write to the data store • Two data stores cannot be connected by a data flow
RULES OF DATA FLOW • Data can flow from • external entity to process • process to external entity • process to store and back • process to process • Data cannot flow from • external entity to external entity • external entity to store • store to external entity • store to store
DATA FLOW DIAGRAMS An alternate notation is often used A Process A Data store
GOOD STYLE IN DRAWING DFD • Use top down development starting from context diagram and successively levelling DFD • Data stores cannot create new data. • Use meaningful names for data flows, processes and data stores. • Only previously stored data can be read. • A process can only transfer input to output. It cannot create new data
DESCRIBING A SYSTEM WITH A DFD • It is called a context diagram • It gives little detail & is also known as the top level DFD • Context diagram of mess management is shown in the next transparency • An entire system is represented by one DFD which gives the system’s overview
CONTEXT DIAGRAM OF MESS • MANAGEMENT SYSTEM
LEVELLING DFD • A context diagram gives an overview • It should be split into major processes which give greater detail. • Each major process is further split to give more detail.
WHY LEVEL DFD? • If a DFD is too detailed it will have too many data flows and will be large and difficult to understand • Start from a broad overview. Expand to details -Idea similar to using procedures and linking these with a main program • Each DFD must deal with one aspect of a big system
EXPANDED DFD FOR HOSTEL • MESS MANAGEMENT
EXPANDED DFD FOR HOSTEL • MESS MANAGEMENT
LEVELLING RULES • If process p is expanded, the process at the next level are labelled as p.1,p.2etc. • All data flow entering or leaving p must also enter or leave its expanded version. • Expanded DFD may have data stores • No external entity can appear in expanded DFD • Keep the number of processes at each level less than 7.
LOGICAL AND PHYSICAL DFD • DFD’S considered so far are called logical DFDs • Physical DFD may depict physical movements of the goods • Physical DFDs can be drawn during fact gathering phase of a life cycle • A physical DFD is similar to a document flow diagram. • It specifies who does the operations specified by the logical DFD